Amazon SageMaker Debugger
Optimize ML models with real-time monitoring of training metrics and system resources
Overview
Amazon SageMaker Debugger makes it easy to optimize machine learning (ML) models by capturing training metrics in real-time such as data loss during regression and sending alerts when anomalies are detected. This helps you immediately rectify inaccurate model predictions such as an incorrect identification of an image. SageMaker Debugger automatically stops the training process when the desired accuracy is achieved, reducing the time and cost of training ML models.
NEW! Amazon SageMaker Debugger can now help you train models faster by automatically profiling and monitoring system resource utilization and sending alerts when resource bottlenecks such as over-utilized CPUs are identified. You can visually monitor and profile system resources including CPUs, GPUs, network, and memory during training within Amazon SageMaker Studio so you can continuously improve resource utilization. SageMaker Debugger correlates system resource usage to different phases of the training job and for specific points in time during training, and provides recommendations on how to adjust resource utilization to help you re-allocate resources for maximum efficiency. Monitoring and profiling works across all leading deep learning frameworks including PyTorch and TensorFlow, without requiring any code changes in your training scripts. Monitoring and profiling of system resources happens in real-time, helping you optimize your ML models faster and at scale.
Automatic detection, analysis, and alerts
Amazon SageMaker Debugger can reduce troubleshooting during training from days to minutes by automatically detecting and alerting you to remediate common training errors such as gradient values becoming too large or too small. Alerts can be viewed in Amazon SageMaker Studio or configured through Amazon CloudWatch. Additionally, the SageMaker Debugger SDK enables you to automatically detect new classes of model-specific errors such as data sampling, hyperparameter values, and out of bound values.
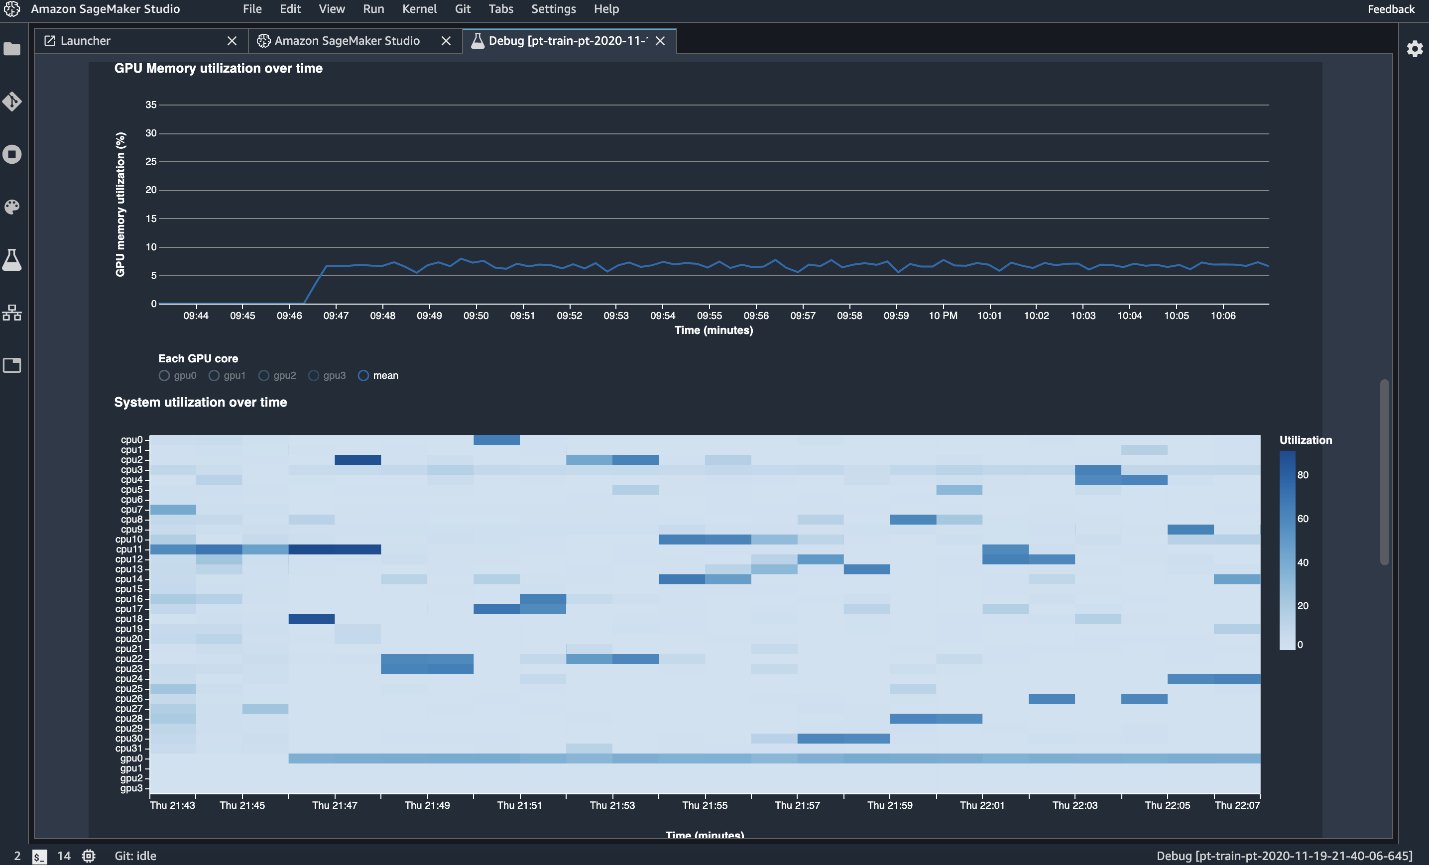
Monitoring and profiling
Amazon SageMaker Debugger automatically monitors utilization of system resources such as GPUs, CPUs, network, and memory, and profiles your training jobs to collect detailed ML framework metrics. You can inspect all resource metrics visually through SageMaker Studio. Anomalies in resource utilization are correlated to specific operations for identification of bottlenecks such as over-utilized CPUs so you can take corrective action quickly. Additionally, a detailed report can be downloaded for offline analysis. Training runs can be profiled either at the start of the training job or at any point when training is in progress.
Built-in analytics
Amazon SageMaker Debugger comes with built-in analytics that automatically analyze data emitted during training such as inputs, outputs, and transformations known as tensors. As a result, you can detect whether a model is overfitting or overtraining, whether gradients are getting too large or too small, whether GPU resources are underutilized, and other bottlenecks during training. With SageMaker Debugger, you can also create your own custom conditions to test for specific behavior in your training jobs. These conditions can invoke actions such as stopping a training job and sending an SMS or email. Early stopping of training jobs will help reduce training costs for suboptimal models and develop better prototypes faster.
Broad support across ML algorithms and DL frameworks
Amazon SageMaker Debugger supports ML frameworks including TensorFlow, PyTorch, Apache MXNet, Keras, and XGBoost. SageMaker’s built-in containers for these frameworks come pre-installed with SageMaker Debugger, enabling you to monitor, profile, and debug your training scripts easily. By default, SageMaker Debugger monitors system hardware utilization and losses during training without writing additional code to monitor each resource separately.
Integration with Amazon Lambda
Amazon SageMaker Debugger is integrated with Amazon Lambda so you can act on results from alerts. For example, Amazon Lambda functions can automatically stop a training job when a non-converging action such as losses continuously increasing rather than decreasing over time, is detected. Amazon Lambda provides notifications to stop training jobs so you can reduce costs and achieve desired results during the early stages of ML development and training.