Amazon IoT SiteWise Features
Amazon IoT SiteWise makes it easy to collect, organize, and analyze data from industrial equipment at scale.
Time series storage integrated with your industrial data lake
Use Amazon IoT SiteWise to store industrial data generated from your equipment in a fast and scalable time series data store.
Amazon IoT SiteWise storage supports two tiers for equipment data: a hot tier optimized for real time applications, and a cold tier optimized for analytical applications. SiteWise helps you to reduce storage cost by keeping recent data in hot tier and moving historical data to a cost optimized storage tier based upon user defined policies.
Hot tier: The hot tier stores frequently accessed data with lower write-to-read latency. You can store in the hot tier data that will be used by industrial applications that need fast access to the latest values of measurements in your equipment such as applications that visualize real-time metrics with an interactive dashboard, or applications that monitor operations and trigger alarms to identify equipment performance issues.
Cold tier: The cold tier stores data in an Amazon Simple Storage Service (S3) bucket in your account, so you can easily integrate it with the rest of your industrial data lake. Use data from the cold tier to create applications that need access to historical data, such as business intelligence (BI) dashboards, artificial intelligence (AI) and machine learning (ML) training, historical reports, and backups.
Amazon IoT SiteWise periodically exports and syncs data from measurements, metrics, transforms, aggregates, asset definitions, and asset model definitions to the cold tier. Regular data sync ensures you have the most updated view of your industrial operations integrated to your Amazon S3 data lake. From there, you can use a host of other Amazon Web Services services such as Amazon IoT Analytics, Amazon Athena, Amazon SageMaker, and Amazon QuickSight to extract better analytical insights from your equipment data and build ML models to optimize your operations.
Asset modeling
You can use Amazon IoT SiteWise to build models of your physical operations so you can easily understand industrial data in the context of your equipment. These models are representations of your assets, processes, and facilities. Once your models are created, you can define an asset hierarchy to accurately represent relationships between devices and equipment within a single facility or across multiple facilities.
Asset metrics
You can map data streams and define static or computed properties for equipment or processes across all facilities, so they're readily available for analysis. Using a built-in library of operators and functions, you can create two different types of custom computations – transforms and metrics. You can define transforms that trigger when data from your equipment arrives. You can define metrics that are computed at user-defined intervals and can be configured for an asset or rolled up from a group of assets. Amazon IoT SiteWise also automatically computes commonly used statistical aggregates such as average, sum, and count over multiple time periods (e.g., 1 min, 1 hour) for equipment data, transforms and metrics. These auto-computed aggregates can be visualized using SiteWise Monitor web applications in near-real time and queried by custom applications.
SiteWise Edge
Amazon IoT SiteWise includes software, SiteWise Edge, which runs on-premises to make it easy to collect, organize, process, and monitor equipment data locally before sending the data to the Amazon Web Services Cloud. You run SiteWise Edge on local hardware such as third-party industrial gateways and computers. SiteWise Edge uses Amazon IoT Greengrass, which provides a local software runtime environment for edge devices to help build, deploy and manage applications. The SiteWise Edge software automates the process of securely connecting to and reading data from your industrial equipment and onsite data servers or historian databases. SiteWise Edge collects this data using multiple industrial protocols including OPC-UA, Modbus and EtherNet/IP, which are provided as pre-packaged connectors that run on Amazon IoT Greengrass.
Once data is collected, you can filter data streams by sampling or comparing against a specified criterion (e.g. air temperature above a user specified threshold), define asset metrics such as Overall Equipment Effectiveness (OEE), or use an Amazon Lambda function to customize how the data is processed. Once the data is processed, you can send the data to Amazon IoT SiteWise in the cloud and for longer term storage and analysis in your industrial data lake you can send to other Amazon Web Services Cloud services such as Amazon S3. In addition, local applications can call Amazon IoT SiteWise query APIs on the SiteWise Edge software to read asset time series data, and computed transforms and metrics.
Data ingestion
In addition to using SiteWise Edge to ingest data into the Amazon Web Services Cloud, Amazon IoT SiteWise supports other data ingestion methods, including the MQTT protocol via integration with Amazon IoT Core. You can use the Amazon IoT message broker to subscribe to a topic that is publishing messages from your industrial equipment, and then use the Amazon IoT Core Rules Engine to route messages to Amazon IoT SiteWise.
Amazon IoT SiteWise also allows any edge or cloud application to send data to Amazon IoT SiteWise by using REST APIs.
Gateway management
You can configure and monitor edge gateways across all facilities and view a consolidated list of active gateways, through the console or using APIs. You can also monitor the health of gateways remotely to view the status of all of your production lines from one place. Gateway metrics that help you monitor the health, status and performance of your gateway resources can also be viewed in the Amazon CloudWatch Metrics console.
SiteWise Monitor
Amazon IoT SiteWise includes the ability to create no-code, fully-managed web applications using SiteWise Monitor for visualizing and interacting with operational data from devices and equipment connected to Amazon IoT. With SiteWise Monitor, you can automatically discover and display asset data that has been ingested and modeled with Amazon IoT SiteWise. You can view asset data and computed metrics in near real time or compare and analyze historical time series data from multiple assets and different time periods. You can visualize data using line and bar charts, add thresholds to these charts, and monitor data against these thresholds. Users can access the web applications from a browser on any web-enabled desktop, tablet or phone and sign-in using IAM credentials from their Amazon Web Services account. Administrators can create one or more web applications to easily share access to asset data with any team in your organization to accelerate insights. These web applications can also be deployed locally using the SiteWise Edge software so you can visualize equipment data in real-time on the factory floor, even when connectivity to the cloud is temporarily disrupted.
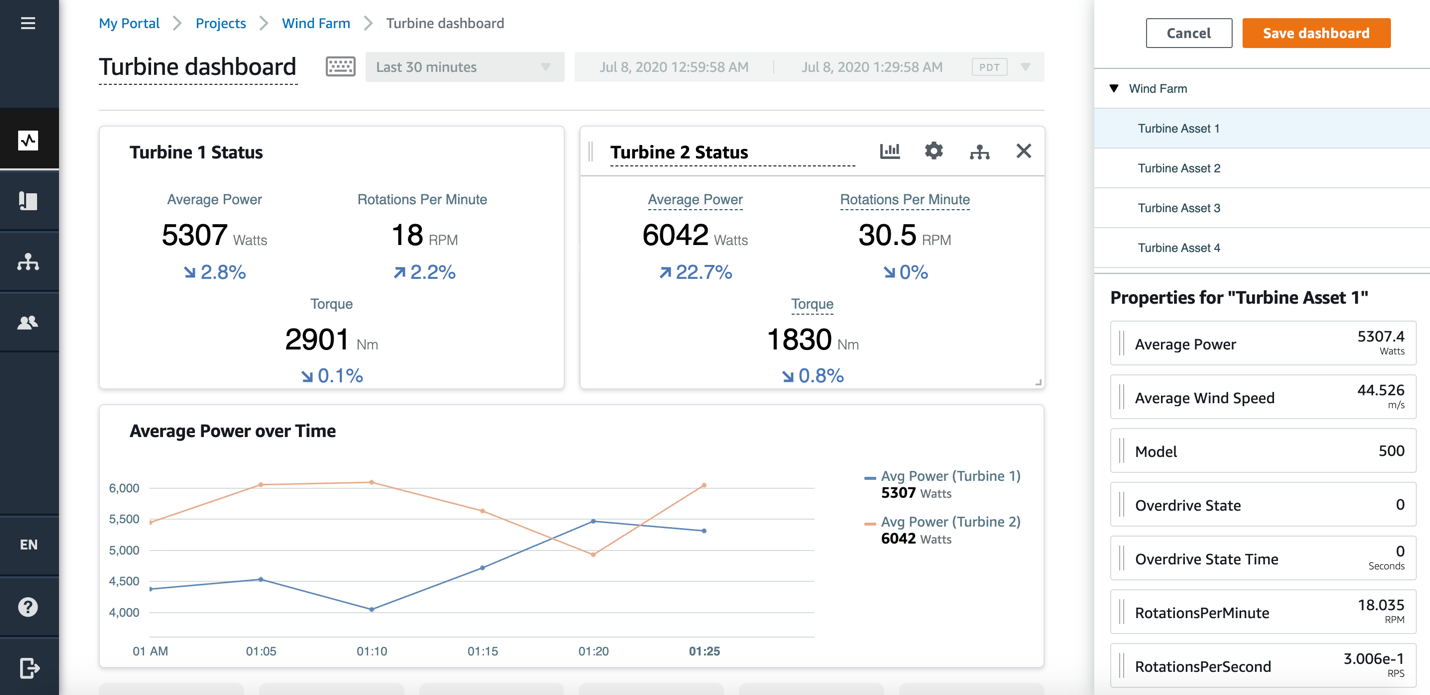 Figure 1: SiteWise Monitor customized web application
Alarms
To assess equipment behavior or identify equipment performance issues, you can define and update alarms, and setup alarm notifications using the Amazon IoT SiteWise console, Amazon IoT SiteWise Monitor, and Amazon IoT SiteWise SDK. For an asset data property that you want to monitor, you can define an alarm rule to apply (e.g. rotations per minute is greater than a user defined value), select the severity for this alarm definition (e.g., severity values of 1, 2, 3 and 4 corresponding to low, medium, high and critical alerts), and configure the notifications to send when an alarm is triggered (e.g. Email and SMS). Once an alarm has been defined, operators can manage the alarm workflow by taking actions to acknowledge, snooze or disable the alarm. You can also configure additional actions to other Amazon Web Services including Amazon Lambda, Amazon Simple Queue Service (SQS), and Amazon Simple Notification Service (SNS), to be executed when an alarm triggers, for example, to integrate alarm notifications with your own ticketing or notification systems.
To visualize equipment alarms, analyze alarm information against live and historical data trends, and determine corrective actions to take (e.g., schedule equipment repair), SiteWise Monitor allows you to preview, display and organize alarm data in a customizable web application. This includes a threshold chart to view live or historical trend lines for asset data or metrics against configured alarm definition thresholds, a status timeline chart to visualize the timeline of alarm state changes, and an alarm table that lists all relevant alarms with key information such as alarm rule, asset name and current alarm state.
Extensibility
Custom edge and cloud applications can use query APIs to easily retrieve asset data and computed metrics from the Amazon IoT SiteWise time series data store, or use a publish/subscribe interface to consume a near real-time stream of structured IoT data. Custom edge applications can also call the same Amazon IoT SiteWise query APIs on the SiteWise Edge software running on-premises to retrieve asset data and metrics, without relying on connectivity to the cloud.