Amazon X-Ray features
Overview
Simple setup
Open allAmazon X-Ray can be used with applications running on Amazon Elastic Compute Cloud (EC2), Amazon EC2 Container Service (Amazon ECS), Amazon Lambda , Amazon Elastic Beanstalk . It’s easy to get started with X-Ray. You just integrate the X-Ray SDK with your application and install the X-Ray agent. With Amazon Elastic Beanstalk, you only have to integrate the X-Ray SDK with your application since the X-Ray agent is pre-installed on Elastic Beanstalk.
End-to-end tracing
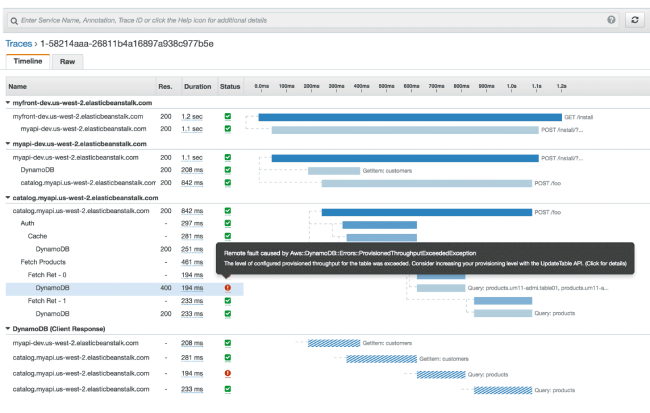
Open allAmazon X-Ray provides an end-to-end, cross-service view of requests made to your application. It gives you an application-centric view of requests flowing through your application by aggregating the data gathered from individual services in your application into a single unit called a trace. You can use this trace to follow the path of an individual request as it passes through each service or tier in your application so that you can pinpoint where issues are occurring.
Amazon X-Ray supports applications running on Amazon Elastic Compute Cloud (Amazon EC2), Amazon EC2 Container Service (Amazon ECS), Amazon Lambda, and Amazon Elastic Beanstalk. The X-Ray SDK captures metadata for requests made to MySQL and PostgreSQL databases (self-hosted, Amazon RDS, Amazon Aurora), and Amazon DynamoDB. It also captures metadata for requests made to Amazon Simple Queue Service and Amazon Simple Notification Service.
Learn more about integrating X-Ray with other Amazon Web Services services here.
Amazon X-Ray supports tracing for applications that are written in Node.js, Java, and .NET.
You can set the trace sampling rate that is best suited for your production applications or applications in development. X-Ray continually traces requests made to your application and stores a sampling of the requests for your analysis. This provides you with the appropriate amount of data to make your analysis meaningful, while avoiding the overhead of storing and managing excessive data volume.
Service map
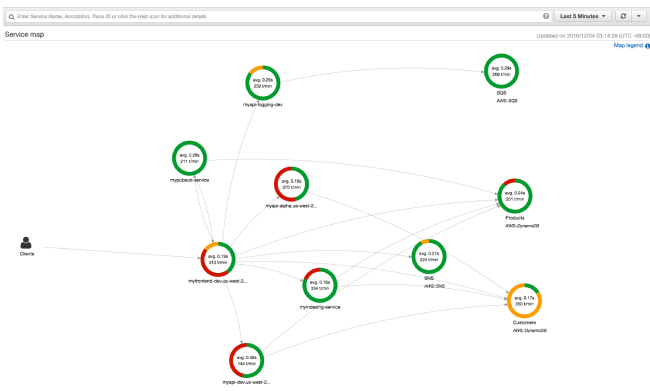
Open allAmazon X-Ray creates a map of services used by your application with trace data that you can use to drill into specific services or issues. This provides a view of connections between services in your application and aggregated data for each service, including average latency and failure rates. You can create dependency trees, perform cross-availability zone or region call detections, and more.
Server- and Client-side latency detection
Open allAmazon X-Ray allows you to visually detect node and edge latency distribution directly from the service map. You can quickly isolate outliers, graph pattern and trends, drill into traces and filter by built-in keys and custom annotations to better understand performance issues impacting your application and end users.
Data annotation and filtering
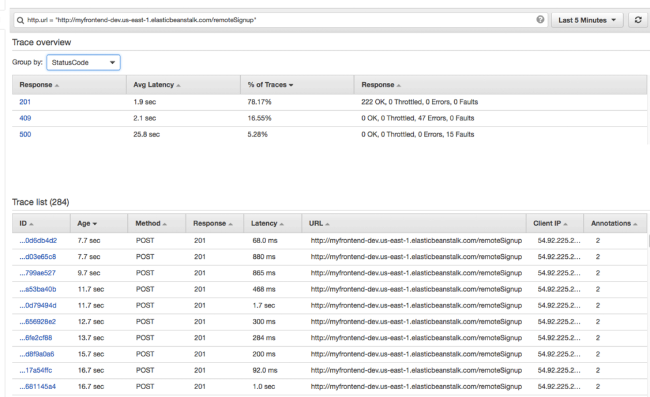
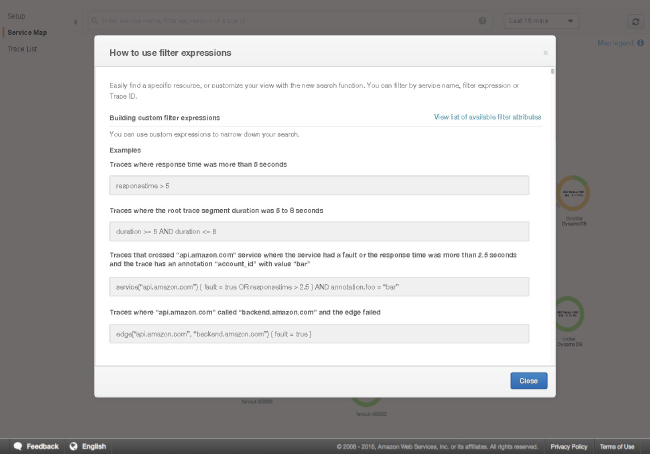
Open allAmazon X-Ray lets you add annotations to data emitted from specific components or services in your application. You can use this to append business-specific metadata that help you better diagnose issues. You can also view and filter data for traces by properties such as annotation value, average latencies, HTTP response status, timestamp, database table used, and more.
Console and programmatic access
Open allYou can use Amazon X-Ray with the Amazon Web Services Management Console, Amazon CLI, and Amazon SDKs. The X-Ray API lets you programmatically access the service so you can easily export trace data or ingest the data into your own tools and custom analytics dashboards.
Security
Open allAmazon X-Ray is integrated with Amazon Identity and Access Management (IAM) so that you can control which users and resources have permission to access your traces and how.
Learn more about Amazon X-Ray pricing
Ready to build?
Have more questions?