We use machine learning technology to do auto-translation. Click "English" on top navigation bar to check Chinese version.
Creating a near-realtime dashboard on Amazon CloudWatch for a Migration usecase
Monitoring performance metrics of Amazon Web Services resources is crucial for any business use case running in cloud. Amazon Web Services Well-Architected Framework
In this blogpost, you will learn how to visualize metrics for several resources on a single Amazon CloudWatch dashboard and make it scalable. We will create a near-realtime dashboard on Amazon CloudWatch with Migration as the use case. The user-defined metrics will be derived from the Amazon Web Services service used for Migration. In this blog, we discuss how to automatically put and update the system-defined and user-defined CloudWatch metrics on the Amazon CloudWatch dashboard.
Architecture
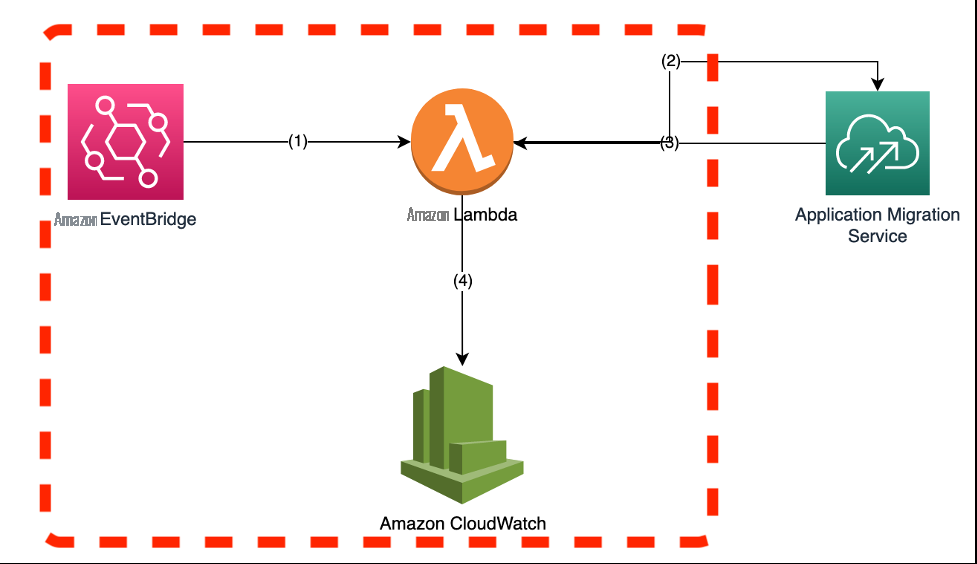 Figure 1. Architecture diagram for creating a near-realtime Amazon CloudWatch Dashboard
This is the architectural diagram for creating a near-realtime dashboard on Amazon CloudWatch for Migration use case. In this blog, we will be monitoring the
1. The solution above starts with an
2. The Amazon Web Services Lambda function will run and gather Amazon CloudWatch metrics from Amazon Web Services MGN for monitoring.
3. The Amazon Web Services Lambda function will then publish these metrics on to a Amazon CloudWatch dashboard. This dashboard will be used by the viewer to see performance metrics or other statistics. The red dotted box in the architecture diagram above can be generalized for any use case.
Solution Overview
1. The Lambda code
Note – The lambda function is compatible with python 3.0 or above. This function is designed to receive metrics from Amazon Web Services MGN and create custom CloudWatch metrics from it. It is designed to create test, cutover and replication state custom metrics and push them on to Amazon CloudWatch. Then, the lambda function is creating an Amazon CloudWatch dashboard and including system-defined metrics provided by Amazon Web Services MGN service and user-defined custom metrics generated by the Lambda function itself. If you are using the above code as is, then please make sure to replace <region> with a specific Amazon Web Services region such as us-east-1 , or us-west-2 etc.
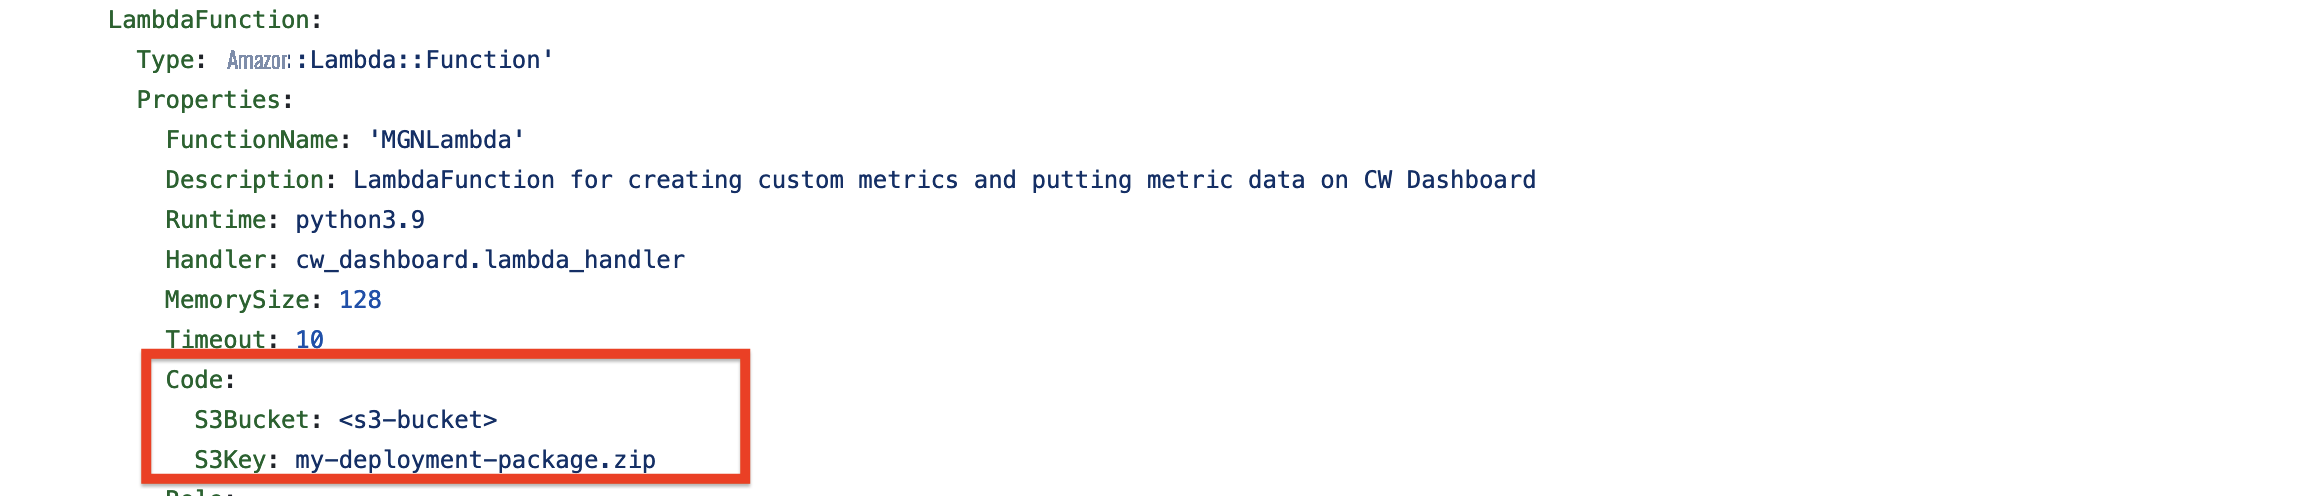
2. Zip the above Lambda function or the custom Lambda function for your use case and upload it to an S3 bucket of your choice. Name the zip file as “my-deployment-package.zip”. Use this
3. Use the YAML template
Make sure that the Amazon Web Services region you choose to deploy the Cloudformation YAML template matches the region in your Lambda function code and the S3 bucket from step 2.
Note that the YAML template creates a Lambda role with the policy that is required to access the Amazon Web Services MGN service.
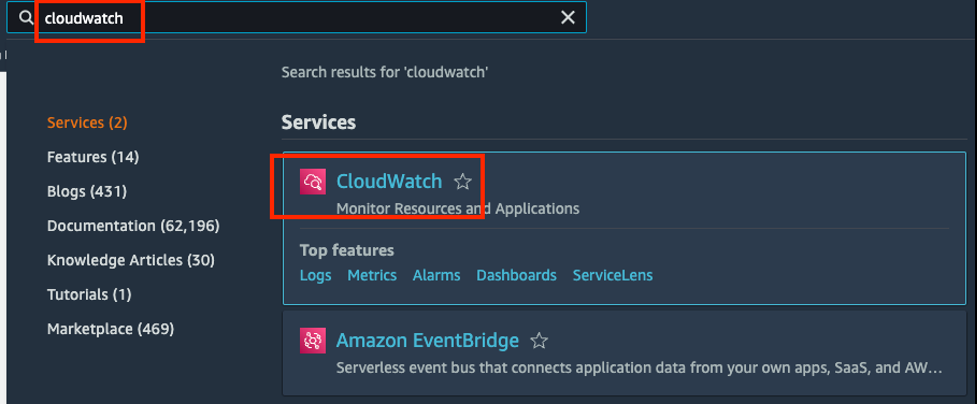
4. Once the environment is deployed by Amazon Web Services CloudFormation, go to Find Services and search for CloudWatch.
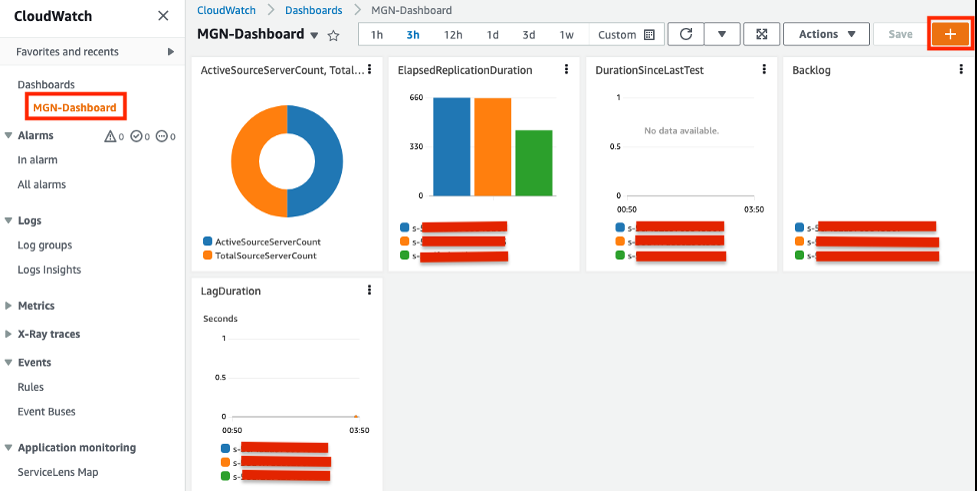
5. On the left navigation pane choose Dashboards , then choose MGN-Dashboard . If you have source machines added in the Amazon Web Services MGN console, then you will see 5 widgets in total. We will add one more in the following steps.
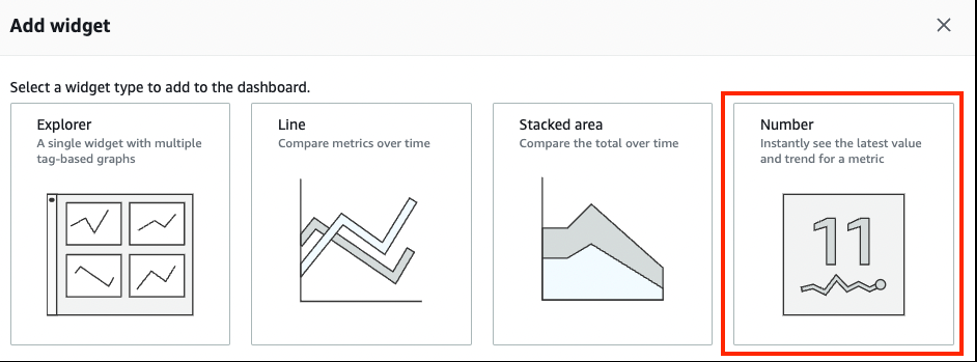
6. In the top right corner, choose the + (plus) button to add a new widget.
7. Choose Number .
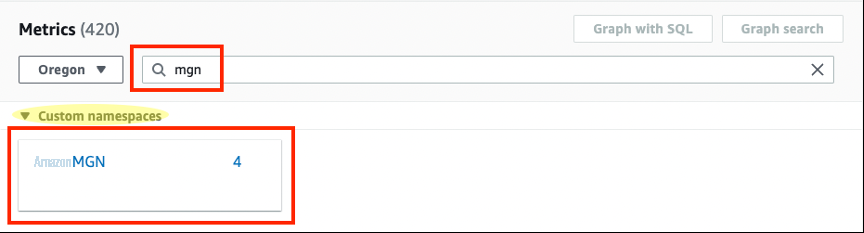
8. Search for mgn in the search bar and choose Amazon Web Services MGN under Custom namespaces.
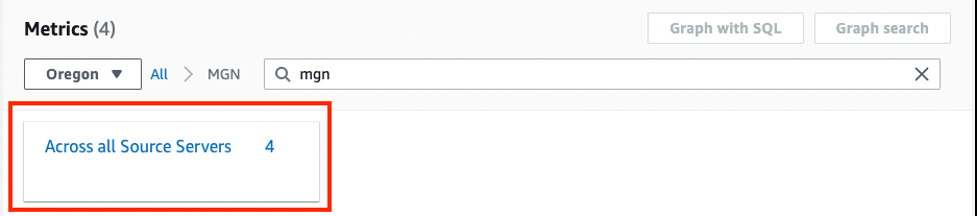
9. Choose Across all Source Servers.
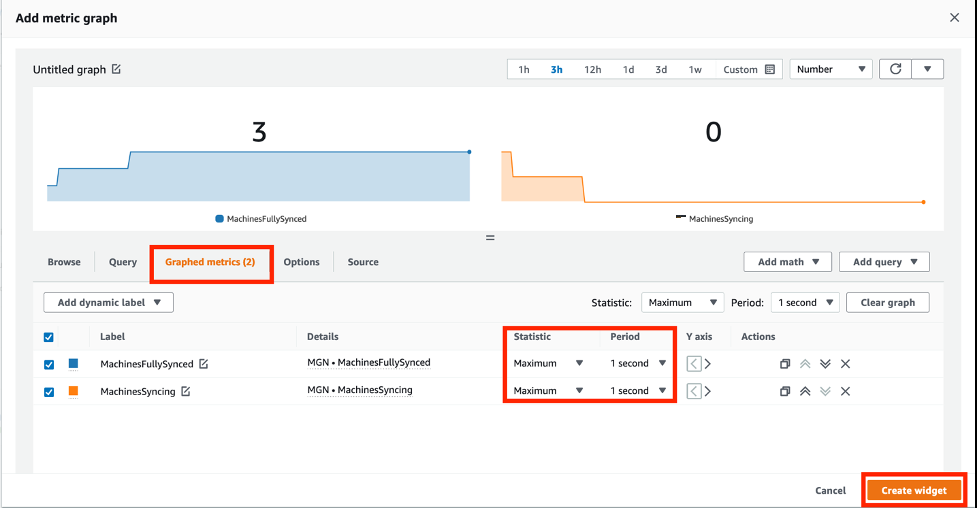
10. Select the first two metrics: MachinesFullySynced and MachinesSyncing . Then select the Graphed metrics tab. Change the statistic for both the metrics to Maximum and Period to 1 second as shown below. Select Create Widget .
11. Similarly, you can add other custom metrics (generated by the lambda function) as widgets to the Amazon CloudWatch dashboard. You can add more metrics to this dashboard after it is created which makes it scalable. The Eventbridge rule runs every 1 min to update this dashboard which also makes it near-realtime.
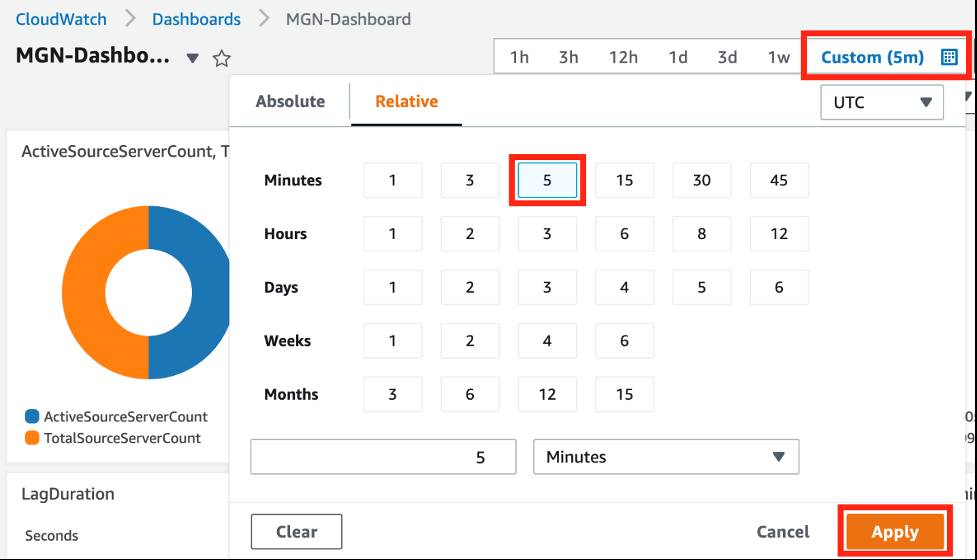
12. Set the duration for events displayed on dashboard to Custom (5m) interval instead of default (3h) so that dashboard only shows data for all metrics during the last 5 minutes.
13. Choose
Save dashboard.
Result
The CloudWatch dashboard is near-realtime that has all the metrics that you added for visualizing the status of your Migration. This CloudWatch dashboard is also scalable as you can continue to add more widgets/metrics without making any changes to the existing
settings.
Conclusion
We saw how easy it is to create a near-realtime dashboard on Amazon CloudWatch and make it scalable for adding more metrics to it. Most system-defined CloudWatch metrics are updated automatically but the solution discussed in this blogpost can also be used for periodically updating the user-defined metrics on the Amazon CloudWatch dashboard. Moreover, you can reuse this solution and some of the existing code for other non-migration use cases as well.
The Cloudwatch charges will be minimal for this scenario but please refer to the CloudWatch
About the author:
The mentioned AWS GenAI Services service names relating to generative AI are only available or previewed in the Global Regions. Amazon Web Services China promotes AWS GenAI Services relating to generative AI solely for China-to-global business purposes and/or advanced technology introduction.