- Products
- Amazon QuickSight
Amazon QuickSight Paginated Reports
Create, schedule, and share reports and data exports
Amazon QuickSight Paginated Reports
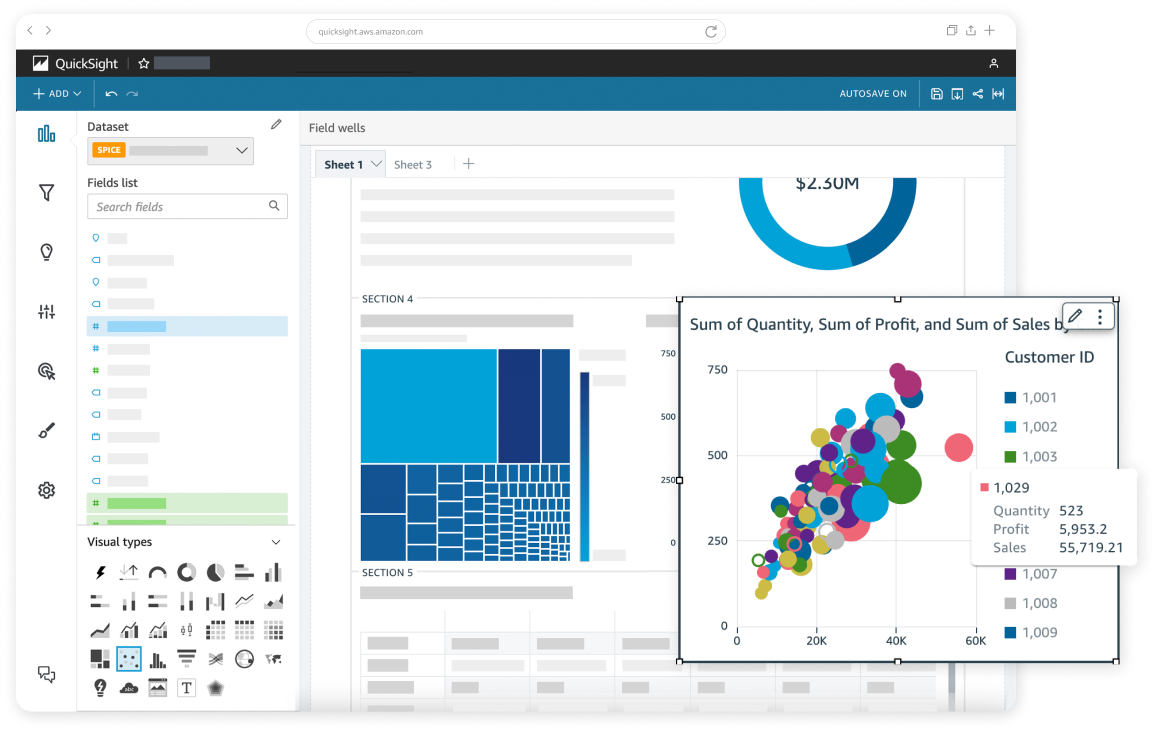
Create, schedule, and share reports and data exports from a single, fully managed, cloud-based business intelligence (BI) solution. Your users can start creating and sharing customized and paginated documents from day one with the straightforward QuickSight interface.
Key benefits
Report business-critical insights
Get business-critical information to users how and when they need it with critical operational reports and dashboards in the same solution.
Scale with ease and reduce costs
With the QuickSight serverless architecture, share your reports at scale, without any hardware management. Reduce costs with the QuickSight consumption-based pricing model.
Innovate with a fully managed BI solution
Access QuickSight new features, including embedded, without expensive and time-consuming upgrade cycles.
Get started fast
Start building critical operational reports without needing special coding skills or learning to use a separate tool.
Use cases
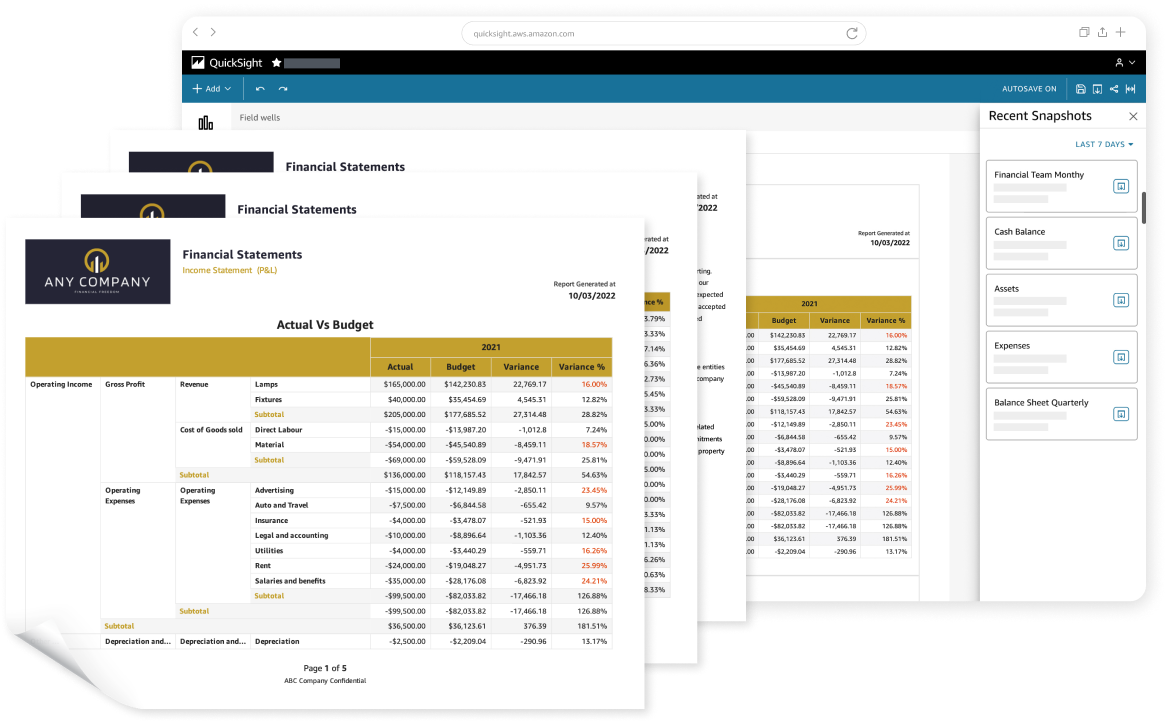
Financial
Profit and loss, balance sheets
Manufacturing
Inventory, shipment status, equipment
Retail
Working capital, net profit margins, vendor payments
Warehouse
Operating costs, on-time shipments, total shipments