In this post, I demonstrate how to improve the performance of real-time analytics and mixed workloads without impacting Online Transaction Processing (OLTP) using the Oracle Database In-Memory option for workloads running on
Amazon Relational Database Service (Amazon RDS) for Oracle
.
The demand for real-time analytics requires analytic queries to be run in real time concurrently with Online Transaction Processing(OLTP) on the same database that has been designed for transaction processing. Enterprise OLTP systems like packaged EPR, CRM, and HCM applications (such as Siebel, PeopleSoft and JD Edwards) are some examples. Additional objects like indexes, materialized views and OLAP cubes are created as a reactive approach to improve the deteriorating performance of analytical workloads, thereby compromising on the OLTP performance. The more indexes, the more overhead of updating the indexes every time the underlying tables are modified. This results in increased memory contention and decreased transaction processing times which is a bottleneck in an extremely busy OLTP system.
What is Oracle Database In-Memory?
Oracle databases store rows in data blocks, and contained within the data for each row is the column data associated with that block. This pattern is optimized for OLTP because updating all columns in a small number of rows results in modifying a small number of blocks. Analytics, on the other hand, access fewer columns but across a large number of rows, often scanning the entire dataset. If we use row format to scan multi-TB heap organized tables with no specific ordering, the result set may be spread across multiple blocks over the entire disk. The I/O involved to fetch those blocks into the cache can be overwhelming. This can be avoided using columnar format, which would access the required columns and avoid scanning inessential data.
Oracle introduced the
Oracle Database In-Memory feature
to accelerate analytic queries by orders of magnitude without sacrificing OLTP performance. It uses a separate columnar format-based memory area within the System Global Area (also known as SGA) called
In-Memory Area
, which exists along with the old row format-based database buffer cache. Therefore, it can store data in blocks both in row and columnar format within the same database. Oracle Cost Based Optimizer (CBO) is aware of the existence of both these memory formats. Customers running their Oracle workloads on Amazon RDS for Oracle can benefit from this feature, which is available for Enterprise Edition Bring your Own License (BYOL) only and as an extra cost option requiring separate
licensing
.
Benefits of Oracle Database In-Memory
Oracle Database In-Memory (IM) has the following benefits:
-
Faster scanning of a large number of rows and applying filters that use operators such as =, <, >, and IN
-
Faster querying of a subset of columns in a table; for example, selecting 7 out of 200 columns
-
Enhance join performance using In-Memory join groups
, converting predicates on small dimension tables to filters on larger fact tables and using bloom filters
-
Efficient
In-Memory aggregation
using
VECTOR GROUP BY
transformations
-
Reductions in indexes, materialized views, and OLAP cubes, and therefore reduced storage and bandwidth demand
-
Reduction in storage costs and accelerated scans with
In-Memory hybrid compression
due to the ability of scanning column data in compressed format
-
Data pruning using storage indexes and faster processing and
In-Memory Arithmetic
using the
SIMD (Single Instruction Multiple Data)
feature of new state-of-the-art processors with software on chip
The
IM column store
maintains copies of tables, partitions, and individual columns in a compressed columnar format that is optimized for rapid scans.
The IM column store stores the data for each table or view by column rather than by row. Each column is divided into separate row subsets. A container called an
In-Memory Compression Unit (IMCU)
stores all columns for a subset of rows in a table segment.
The IM column store resides in the
In-Memory Area
, which is an optional portion of the system global area (SGA). The IM column store doesn’t replace row-based storage or the database buffer cache, but rather supplements it. The database enables data to be within the memory in both a row-based and columnar format, providing the best of both worlds. The IM column store provides an additional transaction-consistent copy of table data that is independent of the disk format.
Identifying a suitable workload
You can leverage
Amazon RDS Performance Insights
for your RDS for Oracle database instance to understand the database workload profile and its performance. When investigating your database workload for any slowness or performance issues, you may find complex SQL queries such as SELECTs accessing multiple tables or views to perform aggregations , filters and sorts across large volumes of data using multiple joins methods in the Top SQL section of your Performance Insights dashboard. You would notice the execution plan for these SQLs is often complex and contain join methods like nested loops or hash joins. Besides, you would see DML (Inserts/Updates and Deletes) statements spanning not more than a few lines. Their execution plans often contain access methods like
index unique scan
,
index fast full scan
,
index skip scan
and
table access by index ROWID
to achieve lower cardinality or to access fewer rows. This is how a mixed workload presents itself.
Investigating further, you need to identify whether the database system is bound by IO, which can be either physical or logical. You would often find spiked up values under
operating system counters
for metrics of type Disk IO for example,
-
os.diskIO.<devicename>.readIOsPS,
-
os.diskIO.<devicename>.writeIOsPS
and
-
os.diskIO.<devicename>.avgQueueLen
Also noticeable will be higher values of
native counters of RDS for Oracle
for example,
-
db.SQL.sorts
(disk)
-
db.Cache.physical reads
and
-
db.Cache.db
block gets from cache
You may also notice an increase in
per-second SQL statistics
for example,
-
db.sql.stats.elapsed_time_per_sec
,
-
db.sql.stats.rows_processed_per_sec
,
-
db.sql.stats.buffer_gets_per_sec
and
-
db.sql.stats.physical_read_requests_per_sec
.
It is important to note that
Per-Call statistics
for some of these SQL statements (often referred to as Online Transaction Processing or OLTP) will have
-
High number of executions per second (
db.sql_tokenized.stats.executions_per_sec
),
-
Sub second values for elapsed time per executions (
db.sql.stats.elapsed_time_per_exec
)
-
And less rows processed per execution (
db.sql.stats.rows_processed_per_exec
)
when compared to other SQLs with relatively less
executions per sec
but larger value of
elapsed time per execution
and
rows processed per second
( often referred to as Online Analytic Processing or OLAP). When you compare tables or views built upon tables which are being accessed in both types of SQL statements, you would notice similarity. Often you would find OLAP queries performing slowly and, in the process, impacting the OLTP workload. You can get the table and access method from execution plans which can be viewed from
Database Load section on the Performance Insights dashboard
, where you can slice the Average Active Sessions (AAS) chart by Plans. The underlying tables which are part of the OLAP queries are ideal candidates for population into the In-Memory Column Store.
It is a recommended to capture these metrics when the same workload is re-run after the identified tables are loaded into the in-Memory column store. A comparison of pre and post metrics would reveal whether the In-Memory option is beneficial for your workload.
Enabling In-Memory for 19c and above on Amazon RDS for Oracle
The basic criteria are to set
INMEMORY_SIZE
to a value greater than zero, which enables the In-Memory column store. The
INMEMORY
area is a separate memory chunk carved out of the available SGA allocated to the instance.
Edit your
custom parameter group
to set the
INMEMORY_SIZE
to the required size. Set
INMEMORY_SIZE
to a minimum of 100 MB. The
COMPATIBLE
initialization parameter must be set to 12.1.0 or higher.
In-Memory Area sizing guide
The In-Memory Area required depends on the database objects stored in it and the
compression method
applied on each object. For highest compression, choose
FOR CAPACITY HIGH
or
FOR CAPACITY LOW
; however, they require additional CPU for decompression. For the best query performance, it’s recommended to choose
FOR QUERY HIGH
or
FOR QUERY LOW
compression methods. Although they consume more memory compared to the other two options, scanning and filtering of data can happen without decompression. You can choose to use the
DBMS_COMPRESSION
interface from the compression advisor. The compression ratio advised may not be correct when you run the advisor on already compressed objects on disk. In such a case, load the object in memory with the desired compression and query against
V$IM_SEGMENTS
to find the compression ratio. You can use the following query for that purpose:
select segment_name, bytes disk, inmemory_size, populate_status, inmemory_compression COMPRESSION, bytes/inmemory_size_comp_ratio from v$im_segments where segment_name='<TABLE_NAME>';
For every object being stored, estimate the memory it consumes. For example, if your analytics workload against a table queries 10 out of 200 columns and almost the entire dataset is scanned, then based on the data type of the column and total number of rows in the table, you can estimate approximately how much memory it may consume. You may choose to run the same analytic query against the buffer cache (without in-memory option enabled) and verify the cached blocks (
v$bh.block#
) and compare with blocks from
dba_tables
to see what percent of the total blocks are loaded into the cache. You can use the following query for that purpose:
select obj.owner, obj.object_name, obj.object_type,
    count(buf.block#) as cached_blocks,
    tab.blocks as total_blocks
from v$bh buf
inner join dba_objects obj
    on buf.objd = obj.data_object_id
inner join dba_tables tab
    on tab.owner = obj.owner
    and tab.table_name = obj.object_name
    and obj.object_type = 'TABLE'
where buf.class# = 1
and buf.status != 'free'
and obj.owner = '<TABLE_OWNER>'
and obj.object_name = '<TABLE_NAME>'
and obj.object_type = 'TABLE'
group by obj.owner, obj.object_name, obj.object_type, tab.blocks;
You can then reduce the final estimate by the factor of the compression ratio as advised by the compression advisor depending on the type of compression used.
If you run arithmetic functions against your
NUMBER
type columns in your table, it would be prudent to enable the
in_memory_optimized_arithmetic
parameter and add another 15% to the estimated size for dual storage. When enabled, the optimizer uses Single Instruction Multiple Data (SIMD) Vector processing to speed up arithmetic operations on columns with the
NUMBER
format, which would otherwise incur significant performance overhead because of their inability to be performed natively in hardware.
In-Memory population on Amazon RDS for Oracle
When you use DDL to specify objects as
INMEMORY
, they are eligible to reside in the IM column store, but you need to populate those objects in the store to actually move them. During population, the database reads the existing row format data from disk, transforms it into columnar format, and then stores it in the IM column store. Transforming new data (for example, modified rows in a table after an insert, update, or delete) into columnar format is called
repopulation
. Population is either on-demand or priority-based.
On-demand population
DDL statements include an
INMEMORY PRIORITY
subclause that provides more control over the population queue. By default,
INMEMORY PRIORITY
for an object is set to
NONE
. The database only populates the object when it’s accessed through a
full table scan
, therefore any access by index or
fetch by rowid
won’t populate the object in the IM column store. Moreover, if the segment on disk is 64 KB or less, it isn’t populated in the IM store; therefore, some small objects enabled for the IM store may not be populated either.
Priority-based population
You can choose priority as
CRITICAL
,
HIGH
, and
LOW
for the objects being populated into the IM store, then the database automatically populates the objects using an internally managed priority queue. In this case, a full scan is not a necessary condition for population.
In this case, the database does the following:
-
Populates columnar data in the IM column store automatically after the database instance restarts.
-
Queues the population of
INMEMORY
objects based on the specified priority level. For example, a table altered with I
NMEMORY PRIORITY CRITICAL
takes precedence over a table altered with
INMEMORY PRIORITY HIGH
, which in turn takes precedence over a table altered with
INMEMORY PRIORITY LOW
. If the IM column store has insufficient space, then Oracle database doesn’t populate additional objects until space is available.
-
Waits to return from
ALTER TABLE
or
ALTER MATERIALIZED VIEW
statements until the changes to the object are recorded in the IM column store.
You can populate tablespaces, tables, and subsets of columns within a specific object or materialized views into the IM column store. However, the following objects are not eligible for the IM column store:
-
Indexes
-
Index-organized tables
-
Hash clusters
-
Objects owned by the sys user and stored in the SYSTEM or SYSAUX tablespace
After a segment is populated in the IM column store, the database only evicts it when the segment is dropped or moved, or when the segment is updated with the
NO INMEMORY
attribute. You can evict a segment manually or by using an
ADO policy
.
How to populate database objects In-Memory
Database
INMEMORY
population can be done using
DBMS_INMEMORY
program units or the
DBMS_INMEMORY_ADMIN.POPULATE_WAIT
procedure, or by using SELECT to force a full table scan on the table (
/*FULL (table_name) NO_PARALLEL (table_name) */
) hint.
How to repopulate database objects In-Memory
There will be modifications on the objects already in the IM column store due to DMLs or DDLs issued against them or their dependent objects; therefore, there is a need to periodically refresh the modified objects. This process is called repopulation.
Because In-memory Compression Unit (
IMCU
) is a read-only structure, any data changes are tracked as snapshot metadata in a
transaction journal.
The repopulation is done automatically (which can be manually controlled using initialization parameters or the
DBMS_INMEMORY
package) in either of the following
two forms
:
-
Threshold-based repopulation
– Repopulation automatically triggers when the threshold on the number of stale entries in the transaction journal or staleness threshold is breached
-
Trickle repopulation
– The IMC0 (In-Memory Coordinator) process checks periodically whether stale rows exist in the transaction journal irrespective of staleness threshold, and it supplements threshold-based repopulation
Other configurable In-Memory parameters on Amazon RDS for Oracle
The following In-Memory parameters are also available on Amazon RDS for Oracle:
-
INMEMORY_CLAUSE_DEFAULT
– You can set this parameter to
INMEMORY
or
NOINMEMORY
. This setting then applies to all new tables and materialized views by default without the need of explicit specification.
-
INMEMORY_EXPRESSIONS_USAGE
– This controls which In-Memory expressions are populated into the IM column store to be used by queries. Accepted values are
ENABLE
,
DISABLE
,
STATIC_ONLY
, and
DYNAMIC_ONLY
. The default is
ENABLE
, meaning both static and dynamic expressions are populated in the IM column store.
-
INMEMORY_FORCE
– This allows only two settings:
DEFAULT
and
OFF
. Other settings like
BASE_LEVEL
and
CELLMEMORY_LEVEL
(exadata-only feature) isn’t applicable for Amazon RDS for Oracle.
-
INMEMORY_QUERY
– This enables or disables the In-Memory feature for the entire database at the system or session level. It’s useful for testing workloads with and without the In-Memory feature.
-
INMEMORY_TRICKLE_REPOPULATE_SERVERS_PERCENT
– This controls the number of background processes used for trickle repopulation.
Things to consider before enabling Database In-Memory in Amazon RDS for Oracle
Consider the following before enabling this feature in Amazon RDS for Oracle:
-
The
In-Memory base level feature
and
Automatic In-Memory
is not available for Amazon RDS for Oracle as of this writing, but you still have the option of manual In Memory population.
-
Resizing the
INMEMORY_SIZE
parameter dynamically without a reboot of the Amazon RDS for Oracle is not possible.
Oracle documentation
mentions that
INMEMORY_SIZE
can be dynamically increased from your current setting without a reboot. However, with Amazon RDS for Oracle, you may either increase, decrease, or completely disable it in the associated parameter group, but it requires a reboot.
-
It’s important to note that the Database In-Memory option is applicable for Enterprise Edition only as an additional cost option, therefore the LI (License Included) model doesn’t apply. You need to have a BYOL (Bring Your Own License) model. It’s advised to integrate with
Amazon Web Services License Manager
to monitor license usage under the BYOL model. License Manager integrates with
Amazon Web Services Systems Manager,
helping discovery of any software installed on your Amazon Web Services resources. You can configure License Manager to help you automatically track licenses of Oracle database engine editions, options, and packs as you grow your database footprint on RDS.
Sometimes, it can be challenging to decide whether or not a table should be populated into the IM column store, especially when you already have a number of tables in the IM store and you are limited by the memory available to your chosen instance type. It is then recommended to use
memory optimized instance types
which offer you a larger memory for the same number of vCPUs. For example, a general purpose
db.m5.12xlarge
offers 192 GiB memory with 48 vCPUs, whereas memory optimized
db.r5.12xlarge
offers 384 GB memory for the same 48 vCPUs. Memory optimized instances are designed to deliver fast performance for workloads that process large data sets in memory, thus being an ideal instance type for In-Memory workloads. The larger memory available with memory optimized instances would also save you from making a difficult choice to evict some of the pre-populated tables to make way for newer ones. Refer to
Amazon RDS Oracle Instance types
to find the available instance types and their configuration.
In the following sections, we discuss how to implement the Oracle Database In-Memory feature and showcase the benefits achieved across comparable Enterprise mixed workloads running on Amazon RDS for Oracle.
Environment setup
We have chosen a 19c (
19.0.0.0.ru-2023-01.rur-2023-01. r1
) Enterprise Edition Oracle database with a db.r5b.4xlarge instance class, which we are connecting using a
SQL*Plus
client installed on an
Amazon Elastic Compute Cloud
(Amazon EC2) instance. Complete the following steps to set up the environment:
-
Create a table named
ORDERS_TAB
in a schema named
admin
. This table contains customers and their order details along with the date or order, city, region, the supply cost, part ordered, and their supplier details, along with the discount and shipping mode.
-
Create a view named
ORDERS_SUMMARY_V
, which contains the order date, customer details, order details, and revenue generated.
-
Insert some random records into the table using a PL/SQL procedure and function, which loops over a random count and inserts a pre-defined array of records.
See the following:
SQL> select count (*) from ORDERS_TAB;

  COUNT(*)
   7934395

SQL>PROMPT ******************************************
PROMPT Show table size/usage
PROMPT ******************************************

col segment_name format a20;
col size heading 'Size (MB)' format  999,999,999;
select segment_name, bytes/1024/1024 "size" from user_segments
where segment_name = 'ORDERS_TAB';

SEGMENT_NAME     Size (MB)
-------------------- ------------
ORDERS_TAB           1,408
-
Edit the custom parameter group to set
INMEMORY_SIZE
to 11 GB and reboot the instance. The
INMEMORY_SIZE
of 11GB has been derived using the In Memory Area sizing guide as described above. The determined size is large enough to accommodate the tables which are being populated into the In Memory store.

Verify the
inmemory_size
parameter setting on the database.
SQL> show parameter inmemory_size

NAME            TYPE          VALUE
------------------------------------
inmemory_size   big integer   11G

SQL>PROMPT ******************************************
PROMPT Show size and populated status in memory
PROMPT ******************************************

col owner format a20;
col segment_name format a20;
col bytes format 999,999,999,999;
col inmemory_size format 999,999,999,999;
col bytes_not_populated heading 'BYTES NOT|POPULATED' format 999,999,999;
col inmemory_priority format a9
select
  owner,
  segment_name,
  bytes,
  populate_status as "POP STATUS",
  inmemory_size,
  bytes_not_populated,
  inmemory_priority
from
  v$im_segments
where
  segment_name in ('ORDERS_TAB')
order by
segment_name;

no rows selected

SQL>
-
Populate the table using a full table scan hint. This is necessary because the table isn’t yet populated in the In-Memory Area.
If you choose to populate objects using a SELECT statement, it may not always force a
full table scan
; the optimizer may choose an
index scan
and the population won’t happen. Therefore, it’s recommended to use a
/*FULL (table_name) NO_PARALLEL (table_name) */
hint as follows to force a full table scan:
select /*FULL (orders_tab) NO_PARALLEL(orders_tab) */ count(*) from orders_tab;
You can also populate the table In-Memory using the
INMEMORY_POPULATE
procedure as follows:
PROMPT ******************************************
PROMPT Populate ORDERS_TAB table
PROMPT ******************************************

ALTER TABLE orders_tab INMEMORY PRIORITY HIGH;

Table altered.

EXEC DBMS_INMEMORY.POPULATE(USER,'ORDERS_TAB');

PL/SQL procedure successfully completed.
-
You can now use the
DBMS_INMEMORY_ADMIN.POPULATE_WAIT function
to wait for IM population and capture the success or failure using the following PL/SQL block:
SET SERVEROUTPUT ON;
PROMPT
PROMPT Wait for IM Population
PROMPT
--
DECLARE
  --
  — populate_wait query
  --
  — Return code:
  —   -1 = POPULATE_TIMEOUT
  —    0 = POPULATE_SUCCESS
  —    1 = POPULATE_OUT_OF_MEMORY
  —    2 = POPULATE_NO_INMEMORY_OBJECTS
  —    3 = POPULATE_INMEMORY_SIZE_ZERO
  --
  co_wait_timeout CONSTANT NUMBER := 3; — Wait up to 3 minutes
  co_priority     CONSTANT VARCHAR2(8) := 'HIGH';
  co_pop_percent  CONSTANT NUMBER := 100;
  co_pop_timeout  CONSTANT NUMBER := 60;
  --
  v_rc            NUMBER;
  v_wait          NUMBER := 0;
  v_done          BOOLEAN := FALSE;
  --
  POP_ERROR       EXCEPTION;
  PRAGMA EXCEPTION_INIT(POP_ERROR, -20000);
  POP_TIMEOUT     EXCEPTION;
  PRAGMA EXCEPTION_INIT(POP_TIMEOUT, -20010);
BEGIN
  WHILE NOT v_done AND v_wait <= co_wait_timeout LOOP
    select dbms_inmemory_admin.populate_wait(
      priority=>co_priority, percentage=>co_pop_percent, timeout=>co_pop_timeout )
    INTO v_rc
    from dual;
    --
    IF v_rc = 0 THEN
      v_done := TRUE;
    ELSIF v_rc = -1 THEN
      v_wait := v_wait + 1;
    ELSE
      RAISE_APPLICATION_ERROR(-20000, 'Error populating IM column store');
    END IF;
    --
    IF v_wait >= co_wait_timeout THEN
      RAISE_APPLICATION_ERROR(-20010, 'Timeout populating IM column store');
    END IF;
  END LOOP;
EXCEPTION
  WHEN POP_ERROR THEN
    DBMS_OUTPUT.PUT_LINE(TO_CHAR(SQLERRM(-20000)));
    RAISE;
  WHEN POP_TIMEOUT THEN
    DBMS_OUTPUT.PUT_LINE(TO_CHAR(SQLERRM(-20010)));
    RAISE;
END;
/
PROMPT
PROMPT In-memory population complete
PROMPT

PL/SQL procedure successfully completed.

SQL> **********************************************
SQL> In-memory population complete
SQL> **********************************************
SQL> Disconnected from Oracle Database 19c Enterprise Edition Release 19.0.0.0.0 - Production Version 19.18.0.0.0
[ec2-user@ip-xxx-xx-xx-xxx inmem]$
-
Check whether the table got populated in-memory:
PROMPT ******************************************
PROMPT Show size and populated status in memory
PROMPT *****************************************

col owner format a20;
col segment_name format a20;
col bytes format 999,999,999,999;
col inmemory_size format 999,999,999,999;
col bytes_not_populated heading 'BYTES NOT|POPULATED' format 999,999,999;
col inmemory_priority format a9
select
  owner,
  segment_name,
  bytes,
  populate_status as "POP STATUS",
  inmemory_size,
  bytes_not_populated,
  inmemory_priority
from
  v$im_segments
where
  segment_name in ('ORDERS_TAB')
order by
segment_name;

******************************************
SQL> Show size and populated status in memory
SQL> ******************************************

                                                             BYTES NOT
OWNER  SEGMENT_NAME  BYTES        POP STATUS  INMEMORY_SIZE  POPULATED INMEMORY_STATUS
------ ------------ ---------     ----------  -------------- --------- ---------------
ADMIN  ORDERS_TAB   1,470,988,288 COMPLETED   411,959,296       0           HIGH
Running enterprise workloads
Let’s run a query where we try to find the order that generated the minimum revenue using the view
orders_summary_v
that we created earlier. This forces the optimizer to use some join filters, sorting, and aggregation, which is usually more like an OLAP type of query. Here is where Oracle Database In-Memory shines.
With Oracle Database In-memory enabled
The following query has the Oracle Database In-Memory feature enabled:
SQL> set timing on
SQL> set echo on
SQL> alter session set statistics_level = all;

Session altered.

Elapsed: 00:00:00.00

SQL> alter session set inmemory_query = enable;

Session altered.

SQL> select
order_key, min(order_revenue)
from   orders_summary_v
where  order_key IN (  select order_key from ORDERS_TAB where line_supplycost = (select max(line_supplycost)
from  ORDERS_TAB where line_quantity > 10 and order_shipmode LIKE 'SHIP%' and order_discount between 5 and 8)
and order_shipmode LIKE 'SHIP%' and order_discount between 5 and 8 ) group by order_key;

ORDER_KEY MIN(ORDER_REVENUE)
---------- ------------------
1504170        828412365

Elapsed: 00:00:00.01

SQL> set lines 500 pages 500;
SQL> set echo off
SQL> set timing off
select * from table(dbms_xplan.display_cursor(NULL, NULL, 'TYPICAL IOSTATS LAST'));

PLAN_TABLE_OUTPUT
----------------------------------------
SQL_ID    183svsjkyysc4, child number 0
----------------------------------------
select     order_key, min(order_revenue) from   orders_summary_v where
order_key IN (    select order_key from ORDERS_TAB where line_supplycost = (select max(line_supplycost)
from  ORDERS_TAB where line_quantity > 10 and order_shipmode LIKE 'SHIP%' and order_discount between 5 and 8)
and order_shipmode LIKE 'SHIP%' and order_discount between 5 and 8) group by order_key

Plan hash value: 80309288

-------------------------------------------------------------------------------------------------
| Id  | Operation              | Name       | E-Rows |E-Bytes| Cost (%CPU)| E-Time    |
-------------------------------------------------------------------------------------------------
|   0 | SELECT STATEMENT          |           |    |    |  5872 (100)|        |
|   1 |  HASH GROUP BY              |           |      1 |    19 |  5872   (8)| 00:00:01 |
|   2 |   VIEW                  | VM_NWVW_1  |      1 |    19 |  5872   (8)| 00:00:01 |
|   3 |    HASH GROUP BY          |           |      1 |    76 |  5872   (8)| 00:00:01 |
|*  4 |     HASH JOIN              |           |      1 |    76 |  3933   (9)| 00:00:01 |
|   5 |      JOIN FILTER CREATE       | :BF0000    |      1 |    33 |  1945   (8)| 00:00:01 |
|*  6 |       TABLE ACCESS INMEMORY FULL  | ORDERS_TAB |      1 |    33 |  1945   (8)| 00:00:01 |
|   7 |        SORT AGGREGATE          |           |      1 |    18 |         |        |
|*  8 |     TABLE ACCESS INMEMORY FULL| ORDERS_TAB |    573K|     9M|  1937   (7)| 00:00:01 |
|   9 |      JOIN FILTER USE          | :BF0000    |   7934K|   325M|  1968   (9)| 00:00:01 |
|* 10 |       TABLE ACCESS INMEMORY FULL  | ORDERS_TAB |   7934K|   325M|  1968   (9)| 00:00:01 |
--------------------------------------------------------------------------------------------------

Predicate Information (identified by operation id):
---------------------------------------------------

4 - access("ORDER_KEY"="ORDER_KEY")
6 - inmemory(("ORDER_DISCOUNT">=5 AND "ORDER_SHIPMODE" LIKE 'SHIP%' AND
           "ORDER_DISCOUNT"<=8 AND "LINE_SUPPLYCOST"=))
    filter(("ORDER_DISCOUNT">=5 AND "ORDER_SHIPMODE" LIKE 'SHIP%' AND
           "ORDER_DISCOUNT"<=8 AND "LINE_SUPPLYCOST"=))
8 - inmemory(("ORDER_DISCOUNT">=5 AND "ORDER_SHIPMODE" LIKE 'SHIP%' AND
           "LINE_QUANTITY">10 AND "ORDER_DISCOUNT"<=8))
    filter(("ORDER_DISCOUNT">=5 AND "ORDER_SHIPMODE" LIKE 'SHIP%' AND
           "LINE_QUANTITY">10 AND "ORDER_DISCOUNT"<=8))
10 - inmemory(SYS_OP_BLOOM_FILTER(:BF0000,"ORDER_KEY"))
     filter(SYS_OP_BLOOM_FILTER(:BF0000,"ORDER_KEY"))


53 rows selected.
With Oracle Database In-memory disabled
To compare the performance of the same query without In-memory, we can set the
ORDERS_TAB
table to
NO INMEMORY
. This disables In-Memory usage for this table, but it also removes the table from the IM column store. If we want to reenable In-Memory for this table, it needs to get populated into the IM store again, which can be challenging in very busy enterprise systems, especially with very large tables. Therefore, it’s recommended to use the
inmemory_query
parameter to disable In-Memory at the session level for workload testing purposes. Now, let’s run the same query with In-Memory disabled:
SQL> set timing on
SQL> set echo on
SQL> alter session set statistics_level = all;

Session altered.

Elapsed: 00:00:00.00

SQL> alter session set inmemory_query = disable;

Session altered.

SQL> select
order_key, min(order_revenue)
from   orders_summary_v
where  order_key IN (  select order_key from ORDERS_TAB where line_supplycost = (select max(line_supplycost)
from  ORDERS_TAB where line_quantity > 10 and order_shipmode LIKE 'SHIP%' and order_discount between 5 and 8)
and order_shipmode LIKE 'SHIP%' and order_discount between 5 and 8 ) group by order_key;

ORDER_KEY MIN(ORDER_REVENUE)
---------- ------------------
1504170        828412365

Elapsed: 00:00:02.49

SQL> set lines 500 pages 500;
SQL> set echo off
SQL> set timing off
select * from table(dbms_xplan.display_cursor(NULL, NULL, 'TYPICAL IOSTATS LAST'));

PLAN_TABLE_OUTPUT
----------------------------------------
SQL_ID    183svsjkyysc4, child number 1
----------------------------------------
select     order_key, min(order_revenue) from   orders_summary_v where
order_key IN (    select order_key from ORDERS_TAB where line_supplycost = (select max(line_supplycost)
from  ORDERS_TAB where line_quantity > 10 and order_shipmode LIKE 'SHIP%' and order_discount between 5 and 8)
and order_shipmode LIKE 'SHIP%' and order_discount between 5 and 8) group by order_key


Plan hash value: 2606829073

---------------------------------------------------------------------------------------
| Id  | Operation        | Name         | E-Rows |E-Bytes| Cost (%CPU)| E-Time   |
---------------------------------------------------------------------------------------
|   0 | SELECT STATEMENT    |         |          |       |   146K(100)|          |
|   1 |  HASH GROUP BY        |         |        1 |    19 |   146K    (1)| 00:00:06 |
|   2 |   VIEW            | VM_NWVW_1  |        1 |    19 |   146K    (1)| 00:00:06 |
|   3 |    HASH GROUP BY    |         |        1 |    76 |   146K    (1)| 00:00:06 |
|*  4 |     HASH JOIN        |         |        1 |    76 | 97571    (1)| 00:00:04 |
|*  5 |      TABLE ACCESS FULL    | ORDERS_TAB |        1 |    33 | 48782    (1)| 00:00:02 |
|   6 |       SORT AGGREGATE    |         |        1 |    18 |        |          |
|*  7 |        TABLE ACCESS FULL| ORDERS_TAB |      573K|     9M| 48795    (1)| 00:00:02 |
|   8 |      TABLE ACCESS FULL    | ORDERS_TAB |     7934K|   325M| 48768    (1)| 00:00:02 |
---------------------------------------------------------------------------------------

Predicate Information (identified by operation id):
--------------------------------------------------

4 - access("ORDER_KEY"="ORDER_KEY")
5 - filter(("ORDER_DISCOUNT">=5 AND "ORDER_SHIPMODE" LIKE 'SHIP%' AND
           "ORDER_DISCOUNT"<=8 AND "LINE_SUPPLYCOST"=))
7 - filter(("ORDER_DISCOUNT">=5 AND "ORDER_SHIPMODE" LIKE 'SHIP%' AND
           "LINE_QUANTITY">10 AND "ORDER_DISCOUNT"<=8))

45 rows selected.
The query ran within a second with the In-Memory feature enabled as compared to 2 minutes, 49 seconds without the feature. This is an approximate 99.94% improvement! This is because there is
improved performance of joins with the use of Bloom filters
when In-Memory is enabled.
Benchmarking using Enterprise workloads
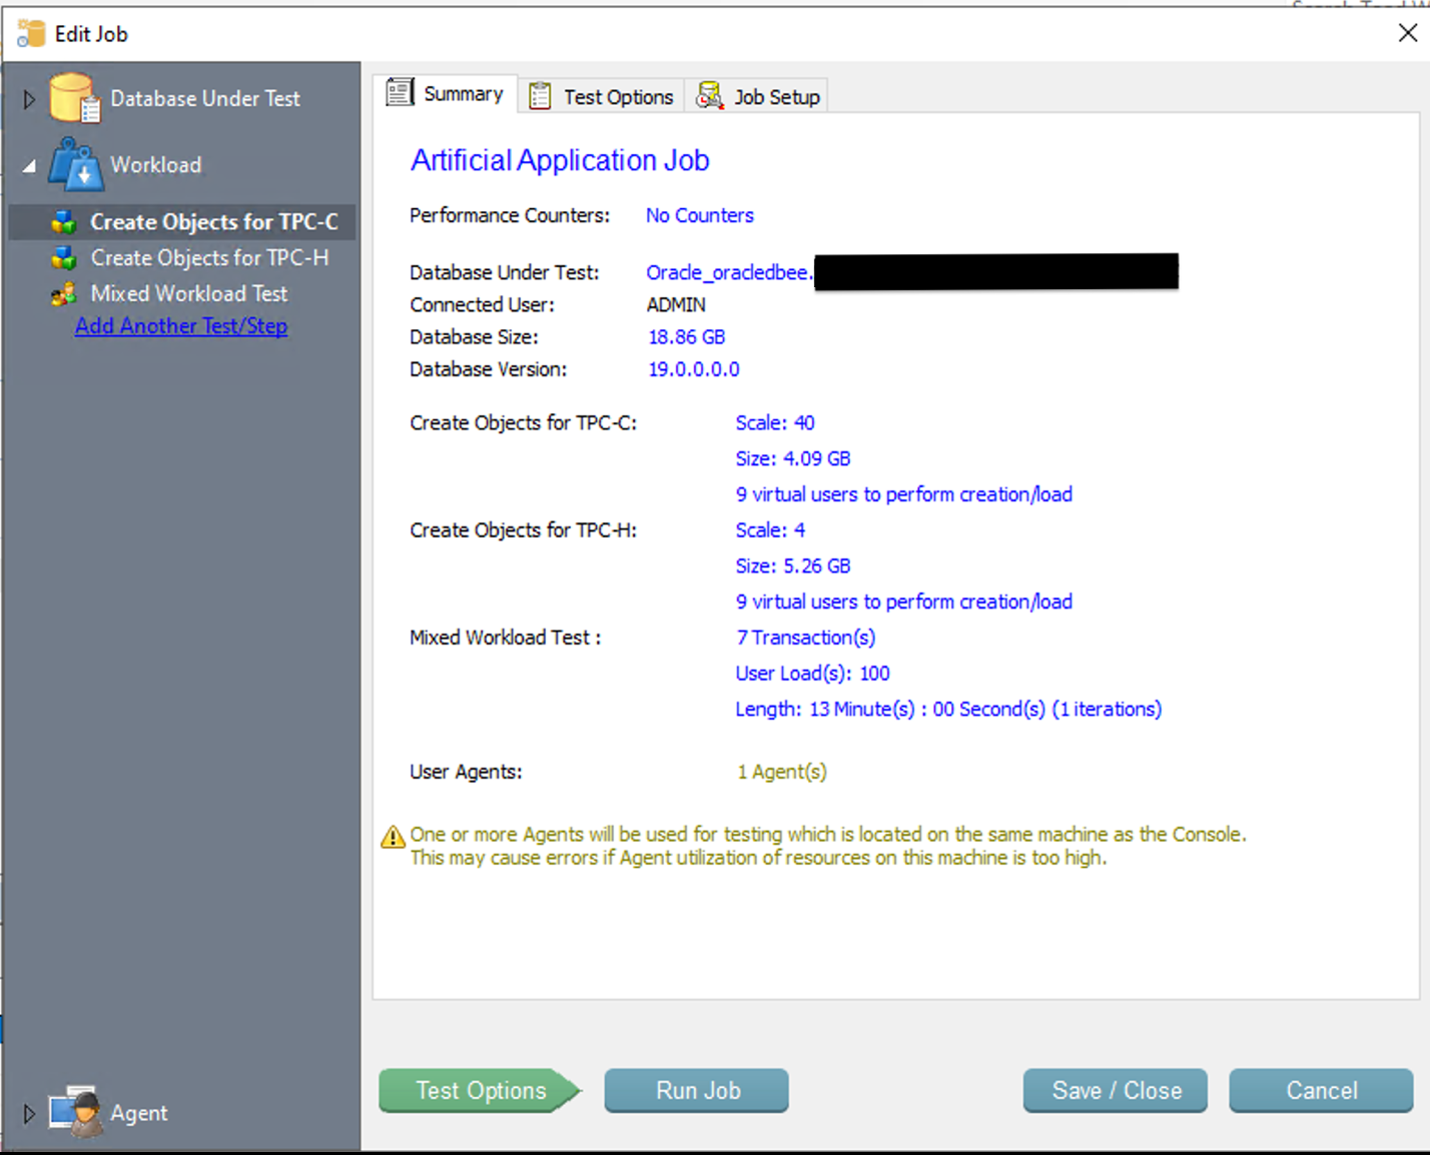
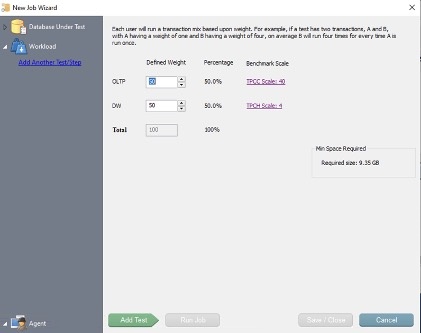
To further understand the benefits of Oracle Database In-Memory, let’s generate a real-world application workload. We use Benchmark Factory to simulate an Enterprise application load by running TPC-C and TPC-H benchmarking tests. We have designed a workload based on a mixture of OLTP (TPC-C Scale: 40) and OLAP (TPC-H Scale:4) transactions. Scale defines the schema size. Both OLTP and OLAP schemas are each around 4.5 GB. OLTP tables are smaller, therefore a higher scale value was needed, whereas OLAP tables are larger fact tables and therefore need a smaller scale. The scale factor has been adjusted based on the
INMEMORY_SIZE
defined on by RDS instance. The database used for the following tests is the same as in the previous test case.
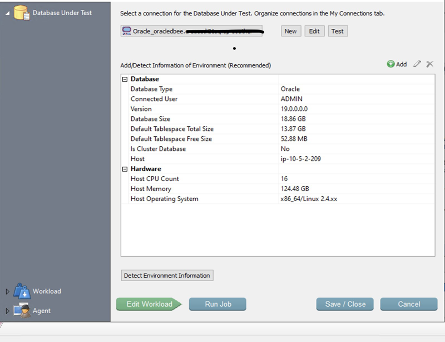
The following screenshot shows the size of the database after the objects required for the mixed workload testing were loaded into the database.
The following screenshot shows details of the mixed workload being run as part of this benchmarking.
The OLTP and OLAP workload is distributed equally as you can see in the following screenshot. TPCC is used for OLTP workloads, whereas TPCH is used for Data Warehouse and analytics.
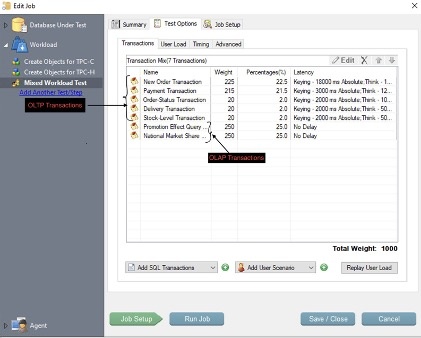
The seven transactions that will be run as part of this testing are a mix of OLTP and OLAP.
Real-world enterprise workload testing with In-Memory disabled
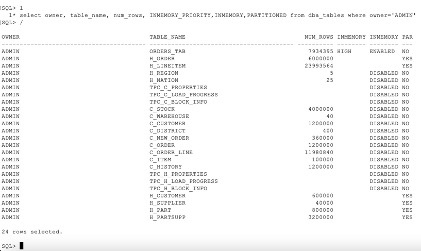
The tables have In-Memory disabled. This includes some partitioned tables for which the
inmemory_status
is reflected in the
dba_tab_partitions
view as seen in the following screenshot.
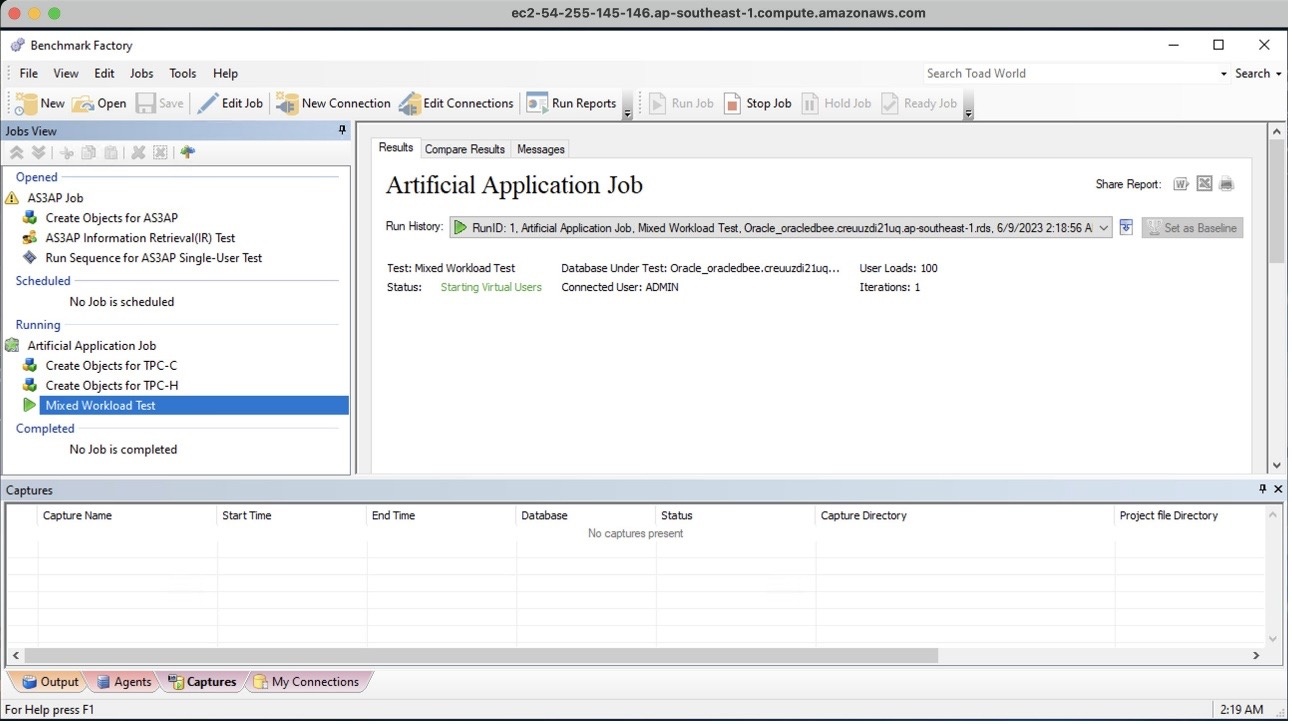
We initiate the test with In-Memory disabled and 100 concurrent users along with OLTP and OLAP workloads running concurrently and randomly.
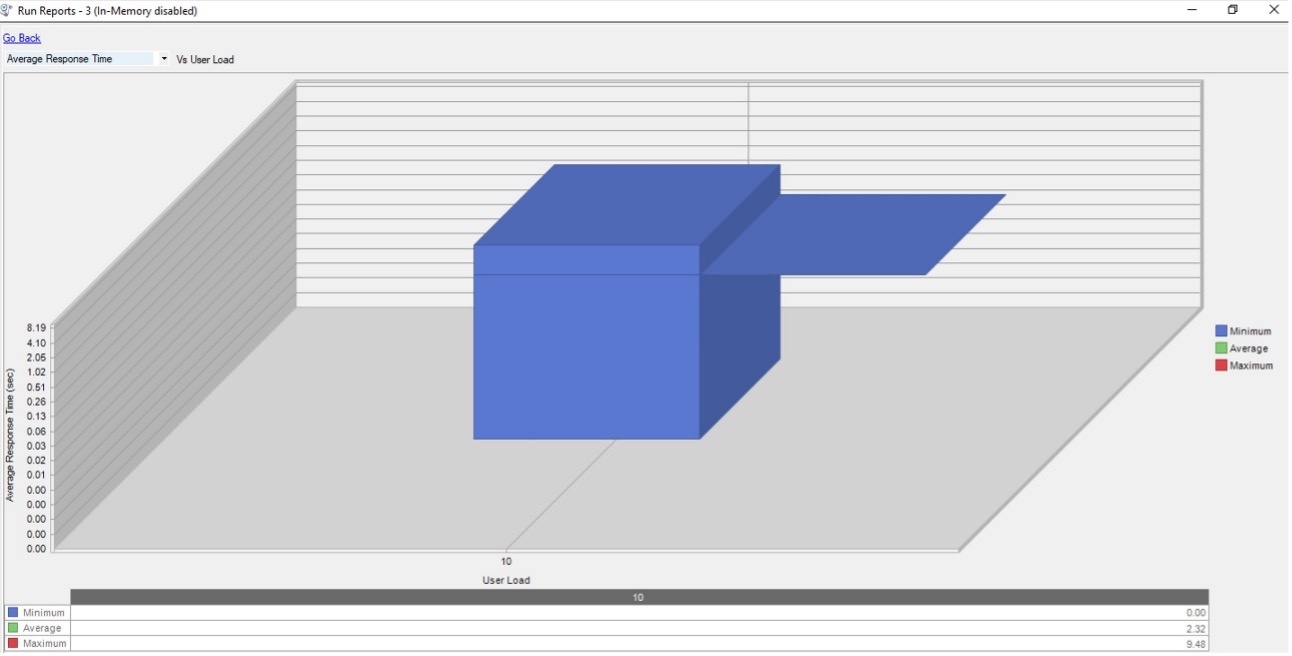
Response time
The following graph (time scale in seconds) shows that the response time peaked at 9.48 seconds, whereas the average value was around 2.32 seconds.
This following graph with time scale in milliseconds shows 0.88 transactions per second, of which the average response time for each of those transactions was around 1,999 milliseconds (approximately 2 seconds).

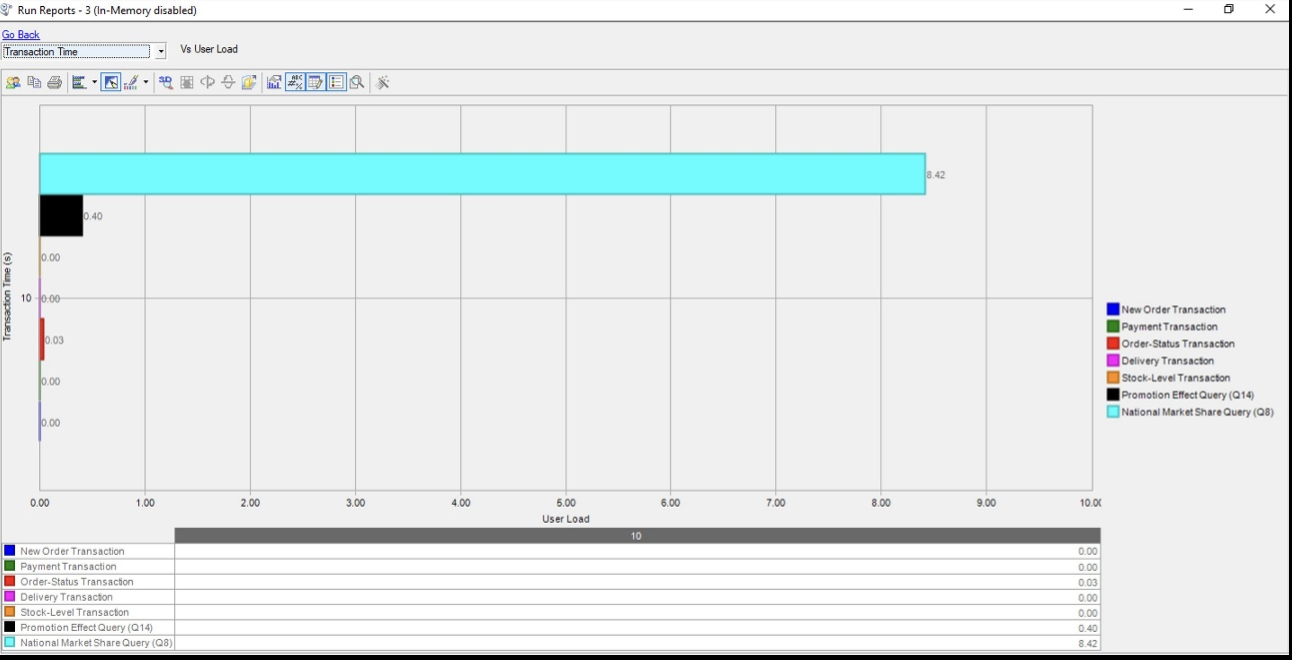
Transaction time
The graph (time scale in seconds) is the breakdown of OLTP and OLAP transactions. The transaction time per run for OLAP queries like National Market Share Query (Q8) is 8.42 seconds, whereas it is 0.40 seconds for Promotion Effect Query (Q14). The OLTP transactions have a sub second transaction time.
Real-world enterprise workload testing with In-Memory enabled
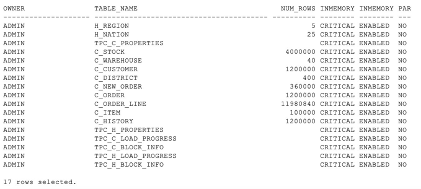
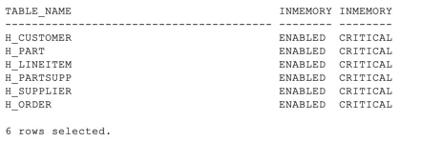
The following tables have been populated into the column store with priority critical.
The following screenshot shows the non-partitioned tables.
The following screenshot shows the partitioned tables.
Subsequently, the tables have been loaded into the IM column store and fully populated. We haven’t used any compression as part of the IM population; therefore, the table sizes are comparable. You can choose to use
COMPRESS
options either using the parameter file or for specific tables as required.
**********************************************
Show table size/usage
**********************************************

SEGMENT_NAME        Size (MB)
-------------------- ------------
C_ORDER_LINE              816
C_CUSTOMER                752
C_ORDER                   47
C_ITEM                     9
C_NEW_ORDER                6
TPC_H_PROPERTIES           0
C_HISTORY                 72
C_WAREHOUSE                0
H_NATION                   0
TPC_C_LOAD_PROGRESS        0
TPC_H_LOAD_PROGRESS        0
C_DISTRICT                 0
C_STOCK                1,408
H_REGION                   0
TPC_C_BLOCK_INFO           0
TPC_C_PROPERTIES           0
TPC_H_BLOCK_INFO           0

17 rows selected.
**********************************************
Show size and populated status in memory
**********************************************
                                                                          BYTES NOT
OWNER    SEGMENT_NAME   BYTES/1024/1024 POP STATUS  INMEMORY_SIZE(MB)     POPULATED
-------------------- -------------------- --------------- ------------- -----------
ADMIN    C_CUSTOMER      748.257813    COMPLETED    733.625                    0
ADMIN C_DISTRICT      .1015625      COMPLETED         1.25                     0
ADMIN C_HISTORY       70.9140625    COMPLETED        33.625                    0
ADMIN C_ITEM          8.796875      COMPLETED         9.25                     0
ADMIN C_NEW_ORDER     5.84375       COMPLETED         2.25                     0
ADMIN C_ORDER         46.203125     COMPLETED         9.625                    0
ADMIN C_ORDER_LINE    812.007813    COMPLETED       253                        0
ADMIN C_STOCK         1402.84375    COMPLETED      1258.5625                   0

8 rows selected.
The same tests were run again with exactly the same parameters.
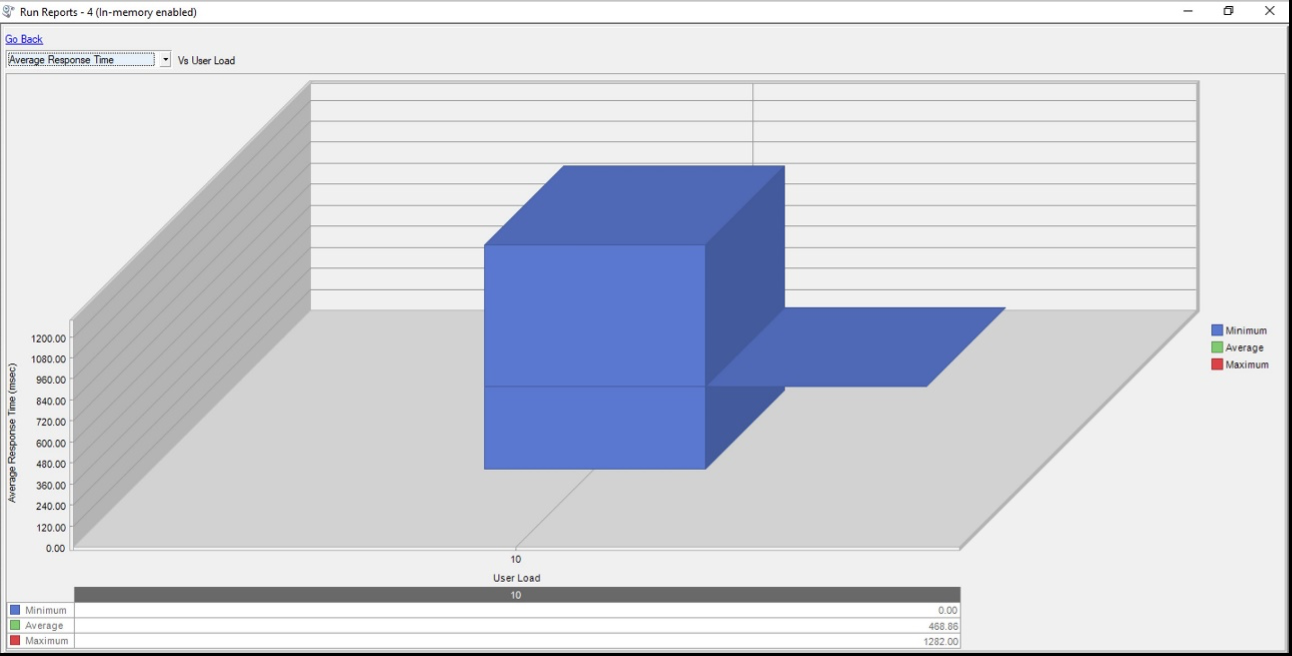
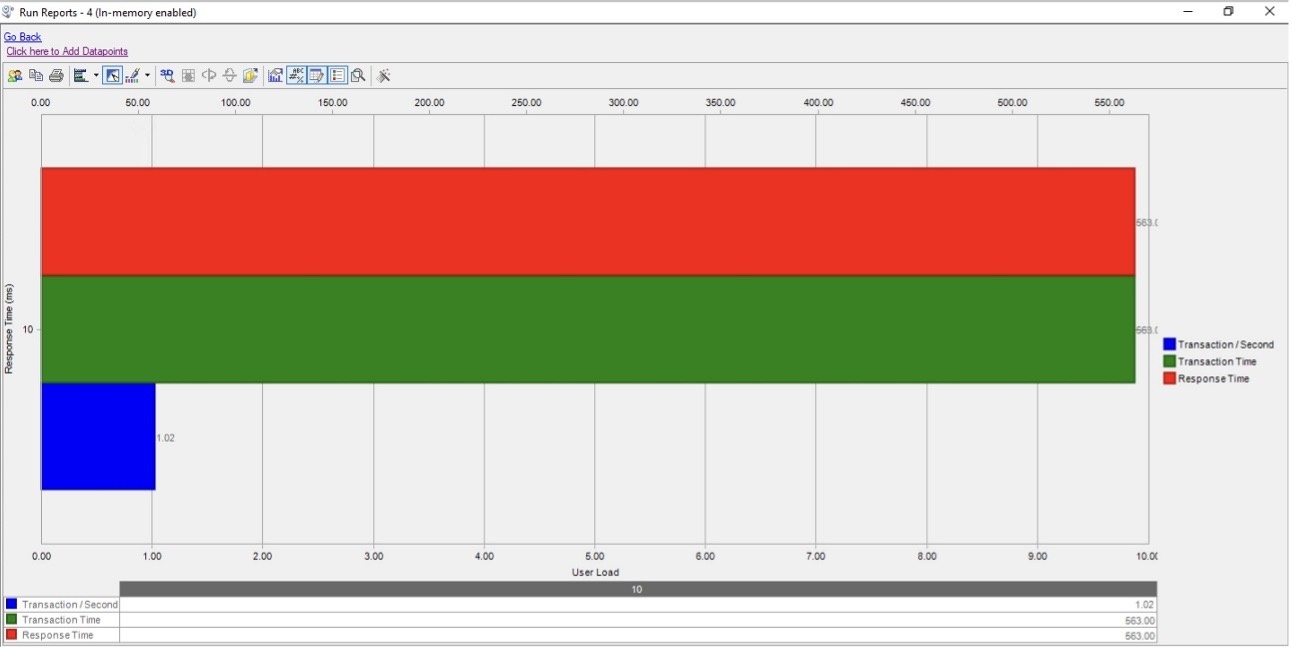
Response time
The following graph with time scale in milliseconds shows that the response time peaked at 1.28 seconds, whereas the average value was around 0.46 seconds.
This following graph with time scale in milliseconds shows there have been 1.02 transactions per second, of which the average response time for each of those transactions was around 563 milliseconds (approximately 0.56 seconds).
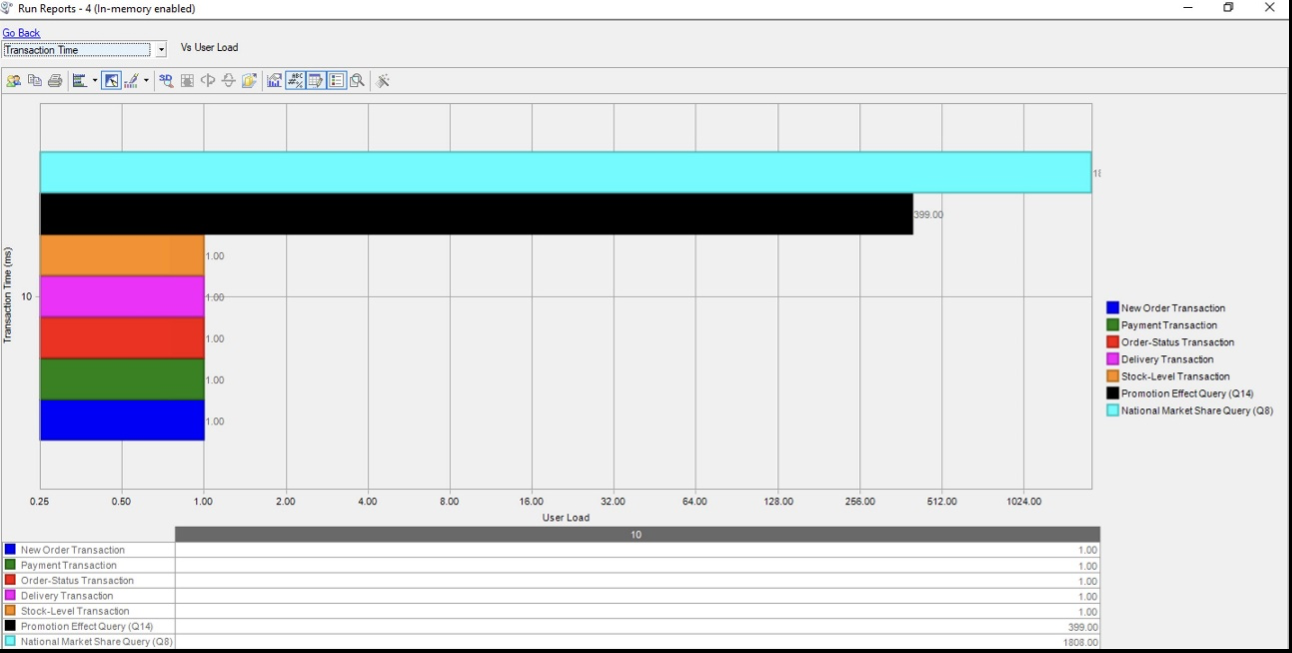
Transaction time
The following graph (time scale in milliseconds) is the breakdown of OLTP and OLAP transactions. The transaction time per run for OLAP queries like National Market Share Query (Q8) is 1.8 seconds, whereas it is 0.39 seconds for Promotion Effect Query (Q14). However, it’s noteworthy that the OLTP transactions remain unaffected with a sub second response time of 0.001 seconds (1 millisecond).
Summary of results
The OLAP queries were 78.62% faster, whereas the OLTP transactions remained unaffected and still delivered sub second transaction times. The response time improved by 86.49% with an average of 1.02 transactions per second, as compared to 0.88 transactions per second when In-Memory is disabled.
The real benefit lies in the fact that enabling In-Memory doesn’t need any application-level changes. It’s as simple as modifying some memory parameters and a few table attributes. It doesn’t impact OLTP and improves OLAP performance drastically.
Conclusion
In this post, we covered the challenges with real-time analytics and how they are remediated using the Oracle Database in-Memory option on Amazon RDS for Oracle. We further demonstrated how to implement this feature and ran some enterprise-level real-time mixed workloads with concurrent users and highlighted the benefits.
We encourage you to evaluate your workload and identify whether it is a suitable candidate to leverage the benefit Oracle Database In-Memory option provides. Leave a comment on this post, ask any questions or provide your feedback.
About the Author
 Ravi Kiran
is a Senior Database Specialist at Amazon Web Services who primarily focusses on Oracle and PostgreSQL database engines. He works with enterprise customers to help them run optimized workloads on Amazon Web Services. He also guides them with best practices for designing and architecting their databases, helping them optimize their costs and provide technical consultation.
