We use machine learning technology to do auto-translation. Click "English" on top navigation bar to check Chinese version.
How to use CloudWatch Logs Insights on Amazon RDS for Oracle log files for real-time analysis
Most database engines log error messages, warnings, traces, and audit statements. Database observability and monitoring are achieved by tracking this log information and taking proactive and reactive actions, such as allocating space when it is low, or stopping sessions causing exclusive locks or connection storms.
In
RDS for Oracle can publish each of these log files to a log group in
In this post, I demonstrate how you can use CloudWatch Logs Insights queries to analyze Oracle alert and listener logs that have been published to CloudWatch Logs. Through these queries, you can observe when ORA- errors are raised and find the frequency of ORA- errors by counting occurrences in the alert logs. Moreover, you can get deeper insights into successful and unsuccessful client connections and their frequency for a deep-dive analysis in listener.log as well.
Solution overview
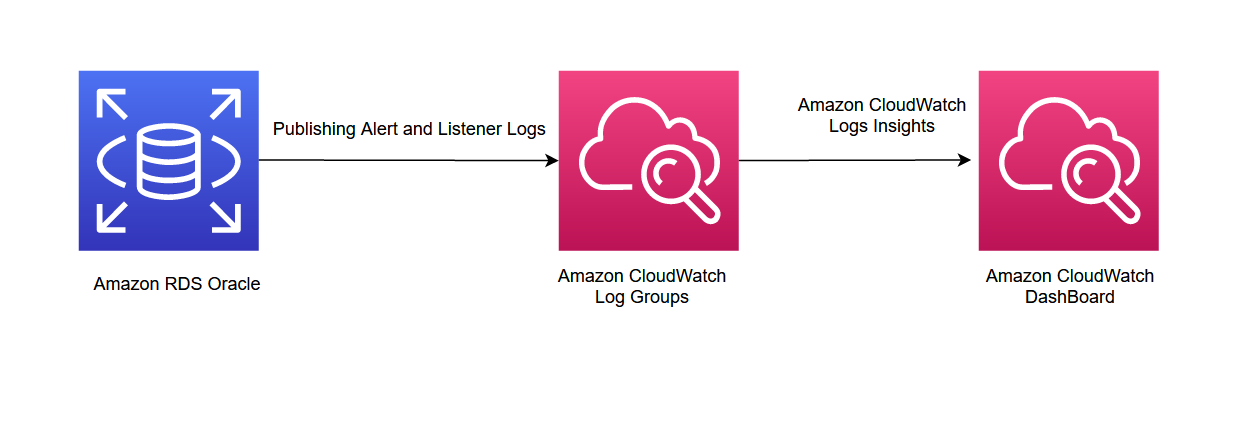
In this post, I recommend publishing alerts and listener logs to CloudWatch Logs. The following diagram illustrates the solution architecture.

The high-level steps are as follows:
- Publish alert and listener log files to CloudWatch Logs.
- Write queries to analyze published logs in CloudWatch Log Groups.
Prerequisites
The following prerequisites are required for this post:
-
An Amazon Web Services account with a running RDS for Oracle instance. For instructions, refer to
Creating and connecting to an Oracle DB instance . -
An
Amazon Elastic Compute Cloud (Amazon EC2)bastion host with an Oracle client to connect to Amazon RDS for Oracle. - Publish alert and listener logs to CloudWatch Logs.
Publish alert and listener logs to CloudWatch Logs
You can
The following screenshot of the Amazon RDS console shows where to select the Alert log and Listener log options for Log exports , under Additional configuration .

Write queries to analyze published logs on CloudWatch Logs
You can use the CloudWatch Logs Insights purpose-built query language to interactively search and analyze your log data in CloudWatch Logs. The following steps show how to create an analysis for common Oracle errors in the alert log and client connections in the listener log:
-
On the CloudWatch console, choose
Log groups
in the navigation pane.

-
Search for and select your instance (for this example,
cwloginsights).

-
To put the specific error code or pattern into the alert log of your instance to test queries without actually encountering errors on your instance, connect your EC2 bastion host and run the
SYS.DBMS_SYSTEM.KSDWRTprocedure throughsqlplus.
The following screenshot shows running
DBMS_SYSTEM.KSDWRT
(2, ‘ORA-01578’) as an example to test the relevant CloudWatch Logs Insights queries.

-
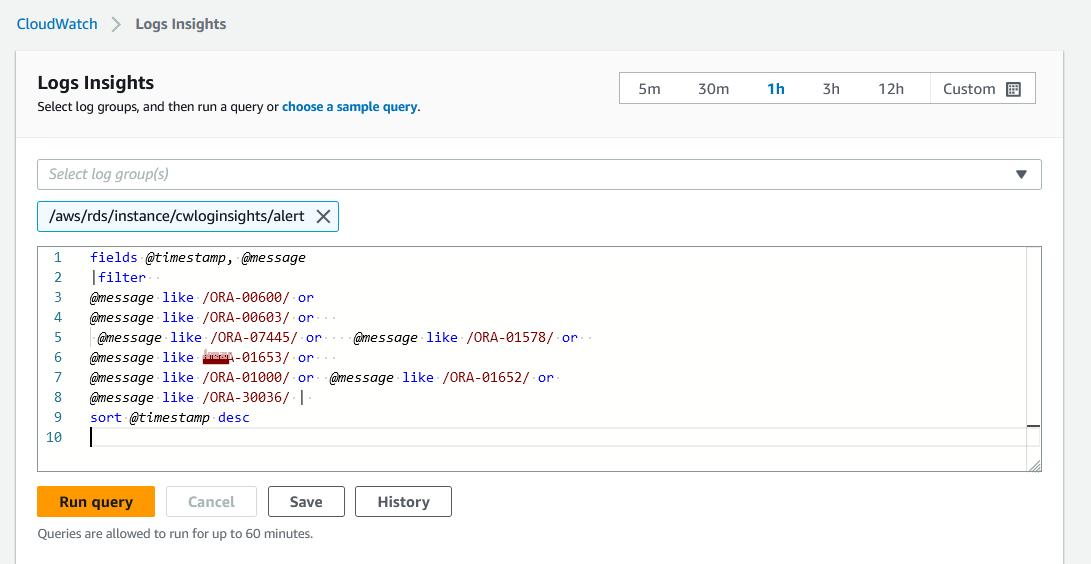
To write CloudWatch Logs Insights queries on the alert log contents, select your log group and choose
View in Logs Insights.

- Run the following queries in the list for particular analysis on the published alert.log
| Log Group | CloudWatch Insights Query | Purpose of The Query |
|
|
fields @timestamp, @message
|filter @message like /ORA-00600/ or @message like /ORA-07445/ or @message like /ORA-01578/ or @message like /ORA-01653/ or @message like /ORA-01000/ or @message like /ORA-01652/ or @message like /ORA-01555/ or @message like /ORA-04036/ or @message like /ORA-30036/ | sort @timestamp desc |
Find timeframe when ORA-errors are seen
ORA-00600-internal error code, argument: ORA-07445- exception encountered: ORA-01578-ORACLE data block corrupted ORA-01653- unable to extend table ORA-01000-maximum open cursors exceeded ORA-01652-unable to extend temp segment by ORA-30036-unable to extend segment by string in undo tablespace ORA-01555 – Snapshot Too Old: Rollback Segment Number ORA-04036: PGA memory used by the instance exceeds PGA_AGGREGATE_LIMIT |
|
|
fields @timestamp, @message
|filter @message like /ORA-00600/ or @message like /ORA-07445/ or @message like /ORA-01578/ or @message like /ORA-01653/ or @message like /ORA-01000/ or @message like /ORA-01652/ or @message like /ORA-01555/ or @message like /ORA-04036/ or @message like /ORA-30036/ |stats count(*) by @message |
Find frequency of ORA-error messages
ORA-00600-internal error code, argument: ORA-07445- exception encountered: ORA-01578-ORACLE data block corrupted ORA-01653- unable to extend table ORA-01000-maximum open cursors exceeded ORA-01652-unable to extend temp segment by ORA-30036-unable to extend segment by string in undo tablespace ORA-01555 – Snapshot Too Old: Rollback Segment Number ORA-04036: PGA memory used by the instance exceeds PGA_AGGREGATE_LIMIT |
-
Choose
Run query
.

By choosing the desired timeframe from 5-minute to customized one, you can make online and offline analysis. Frequently run queries can be stored for later use with the ‘Save’ feature.
You can use also queries on published listener logs via CloudWatch Logs Insights by selecting the listener log group belonging to the instance (for this example,
cwloginsights
).

With the help of the queries in the table below, you can analyze listener logs for several reasons such as problem troubleshooting online or offline by choosing the proper timeframe
| Log Group | Insights Query | Purpose of The Query |
|
|
fields @timestamp, @message
| filter (@message not like ‘127.0.0.1’) and (@message like /establish/) | sort @timestamp desc |
Find client connections from network layer by listing successful client connections |
|
|
fields @timestamp, @message
| filter (@message not like ‘127.0.0.1’) and (@message like /establish/) | stats count(*) by @message |
Find successful connection frequency for client connections |
|
|
fields @timestamp, @message
| filter (@message not like ‘127.0.0.1’) and (@message like /establish/) and @message like /PROGRAM=sqlplus/ | stats count(*) by @message |
Find successful connection frequency for client connections through sqlplus |
|
|
fields @timestamp, @message
| filter (@message like /TNS-/ | sort @timestamp desc |
Find unsuccessful client connections |
|
|
fields @timestamp, @message
| filter (@message like /TNS-/ | stats count(*) by @message |
Find unsucessfull number of connections of client connections |
|
|
fields
@timestamp
,
@message
| filter ( @message not like ‘127.0.0.1’) and ( @message like /establish/) | parse ‘*-*-* establish’ as saat, tns, protocol | stats count() by bin(1m) tns |
Find successfull connections numbers from the same client every minute |
Clean up
Several of the services discussed in this post fall within the
You can find detailed pricing on the
To avoid incurring any unexpected charges, you should delete any unused resources. Additionally, delete your CloudWatch log groups when you no longer need them.
Summary
In this post, I demonstrated how to use CloudWatch Logs Insights queries to analyze the alert and listener logs of Amazon RDS for Oracle. By creating real-time and offline analyses of these logs, you can take proactive and reactive actions. In this way, operational excellence can be achieved.
Use
If you have follow-up questions or feedback, please leave a comment. We’d love to hear your thoughts and suggestions.
About the Author
 Belma Canik
is a Database Specialist Technical Account Manager (STAM) at Amazon Web Services. She helps customers run optimized workloads on Amazon Web Services and make the best out of their cloud journey.
The mentioned AWS GenAI Services service names relating to generative AI are only available or previewed in the Global Regions. Amazon Web Services China promotes AWS GenAI Services relating to generative AI solely for China-to-global business purposes and/or advanced technology introduction.