We use machine learning technology to do auto-translation. Click "English" on top navigation bar to check Chinese version.
Automate rollbacks for Amazon ECS rolling deployments with CloudWatch alarms
Introduction
Background
By default, when the tasks in a service are unable to reach a healthy state, the scheduler applies the
Even if the tasks in a service reach a healthy state, there are several reasons why a deployment may need to be rolled back. The service could have had changes introduced to its code or configuration, causing its performance to degrade from an established baseline in a given environment. This can be detected by monitoring a set of metrics collected from the service using Amazon CloudWatch. These could be system metrics such as the CPU, memory utilization, or custom service metrics such as average response latency.
Customers that deploy their services to Amazon ECS using
How does it work?
When customers create or update services with Amazon ECS API using a JSON string, they can configure one or more Amazon CloudWatch metric alarms in the
deploymentConfiguration
field as shown in the following:
"deploymentConfiguration":{
   "deploymentCircuitBreaker":{
      "enable":true,
      "rollback":true
   },
   "maximumPercent":200,
   "minimumHealthyPercent":50,
   "alarms":{
      "alarmNames":[
         "HighResponseLatencyAlarm"
      ],
      "enable":true,
      "rollback":true
   }
}
The Command Line Interface (CLI) equivalent of the above, namely, the
--deployment-configuration
argument, is shown in the following:
--deployment-configuration "maximumPercent=200,minimumHealthyPercent=50,deploymentCircuitBreaker={enable=true,rollback=true},alarms={alarmNames=[HighResponseLatencyAlarm],enable=true,rollback=true}"
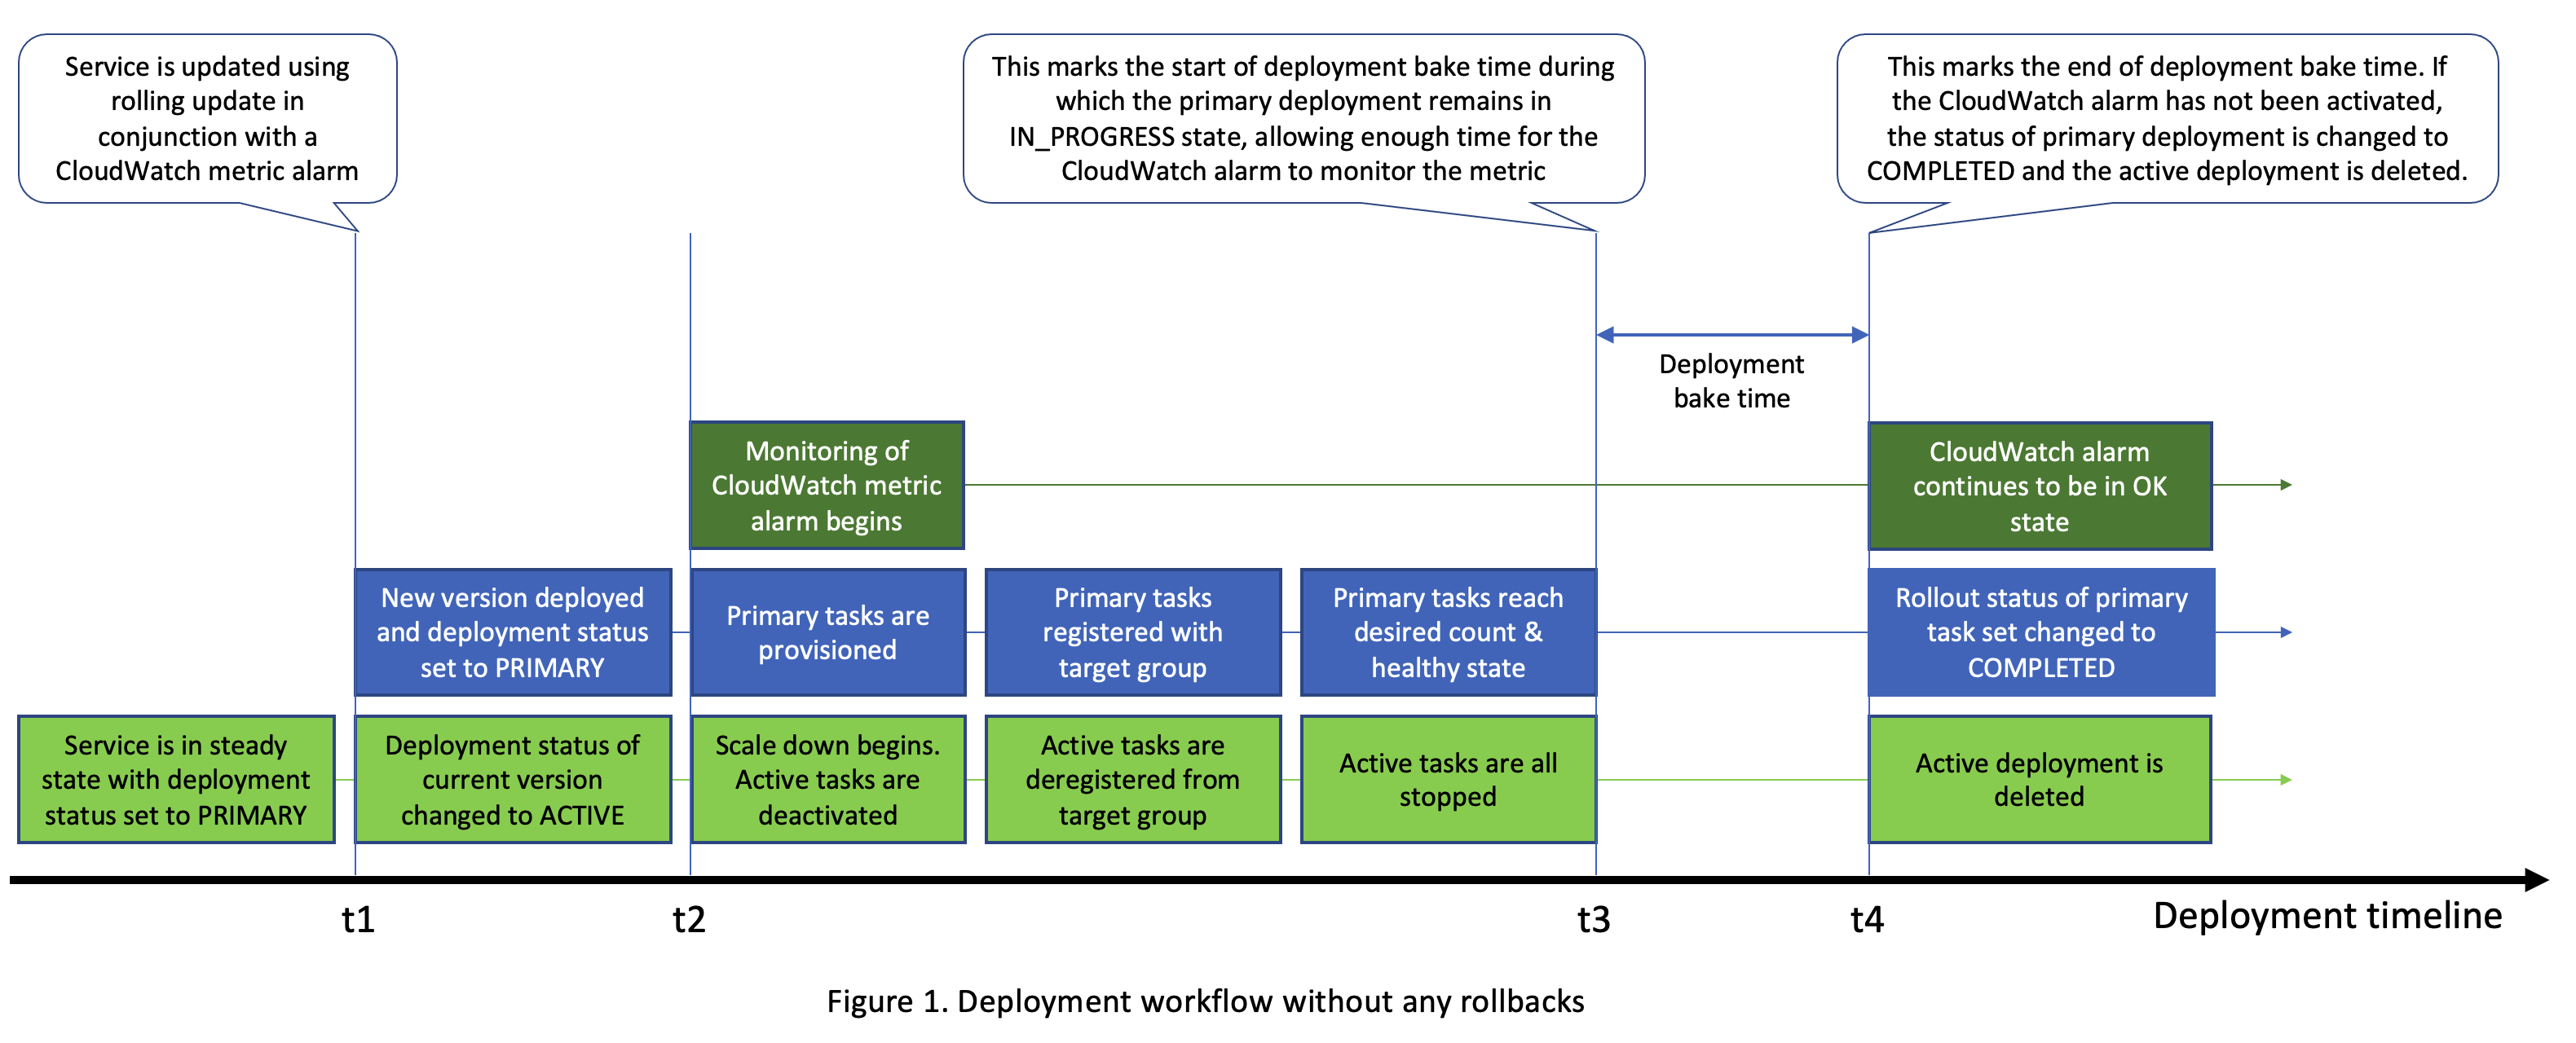
Referring to Figure 1 below, during a rolling update, Amazon ECS starts monitoring the list of configured Amazon CloudWatch alarms as soon as one or more tasks of the updated service (i.e., these tasks now make up the
primary
deployment, while the previously running tasks make up the
active
deployment) are in a running state (t = t2). When a rolling update is done without configuring any alarms, the deployment process is deemed complete when the primary deployment is healthy and has reached the desired count and the active deployment has been scaled down to 0. The timeline in Figure 1 shows both these events occurring at t = t3 but in most use cases they may be staggered, depending on factors such as target group de‑registration delay and health check settings (in case the service uses a load balancer). If you configure alarms, the deployment process is allowed to continue for an additional duration referred to as the
bake time
. During this period, the primary deployment remains in the IN_PROGRESS state. The length of this duration is calculated by Amazon ECS based on the properties of the Amazon CloudWatch alarms such as their
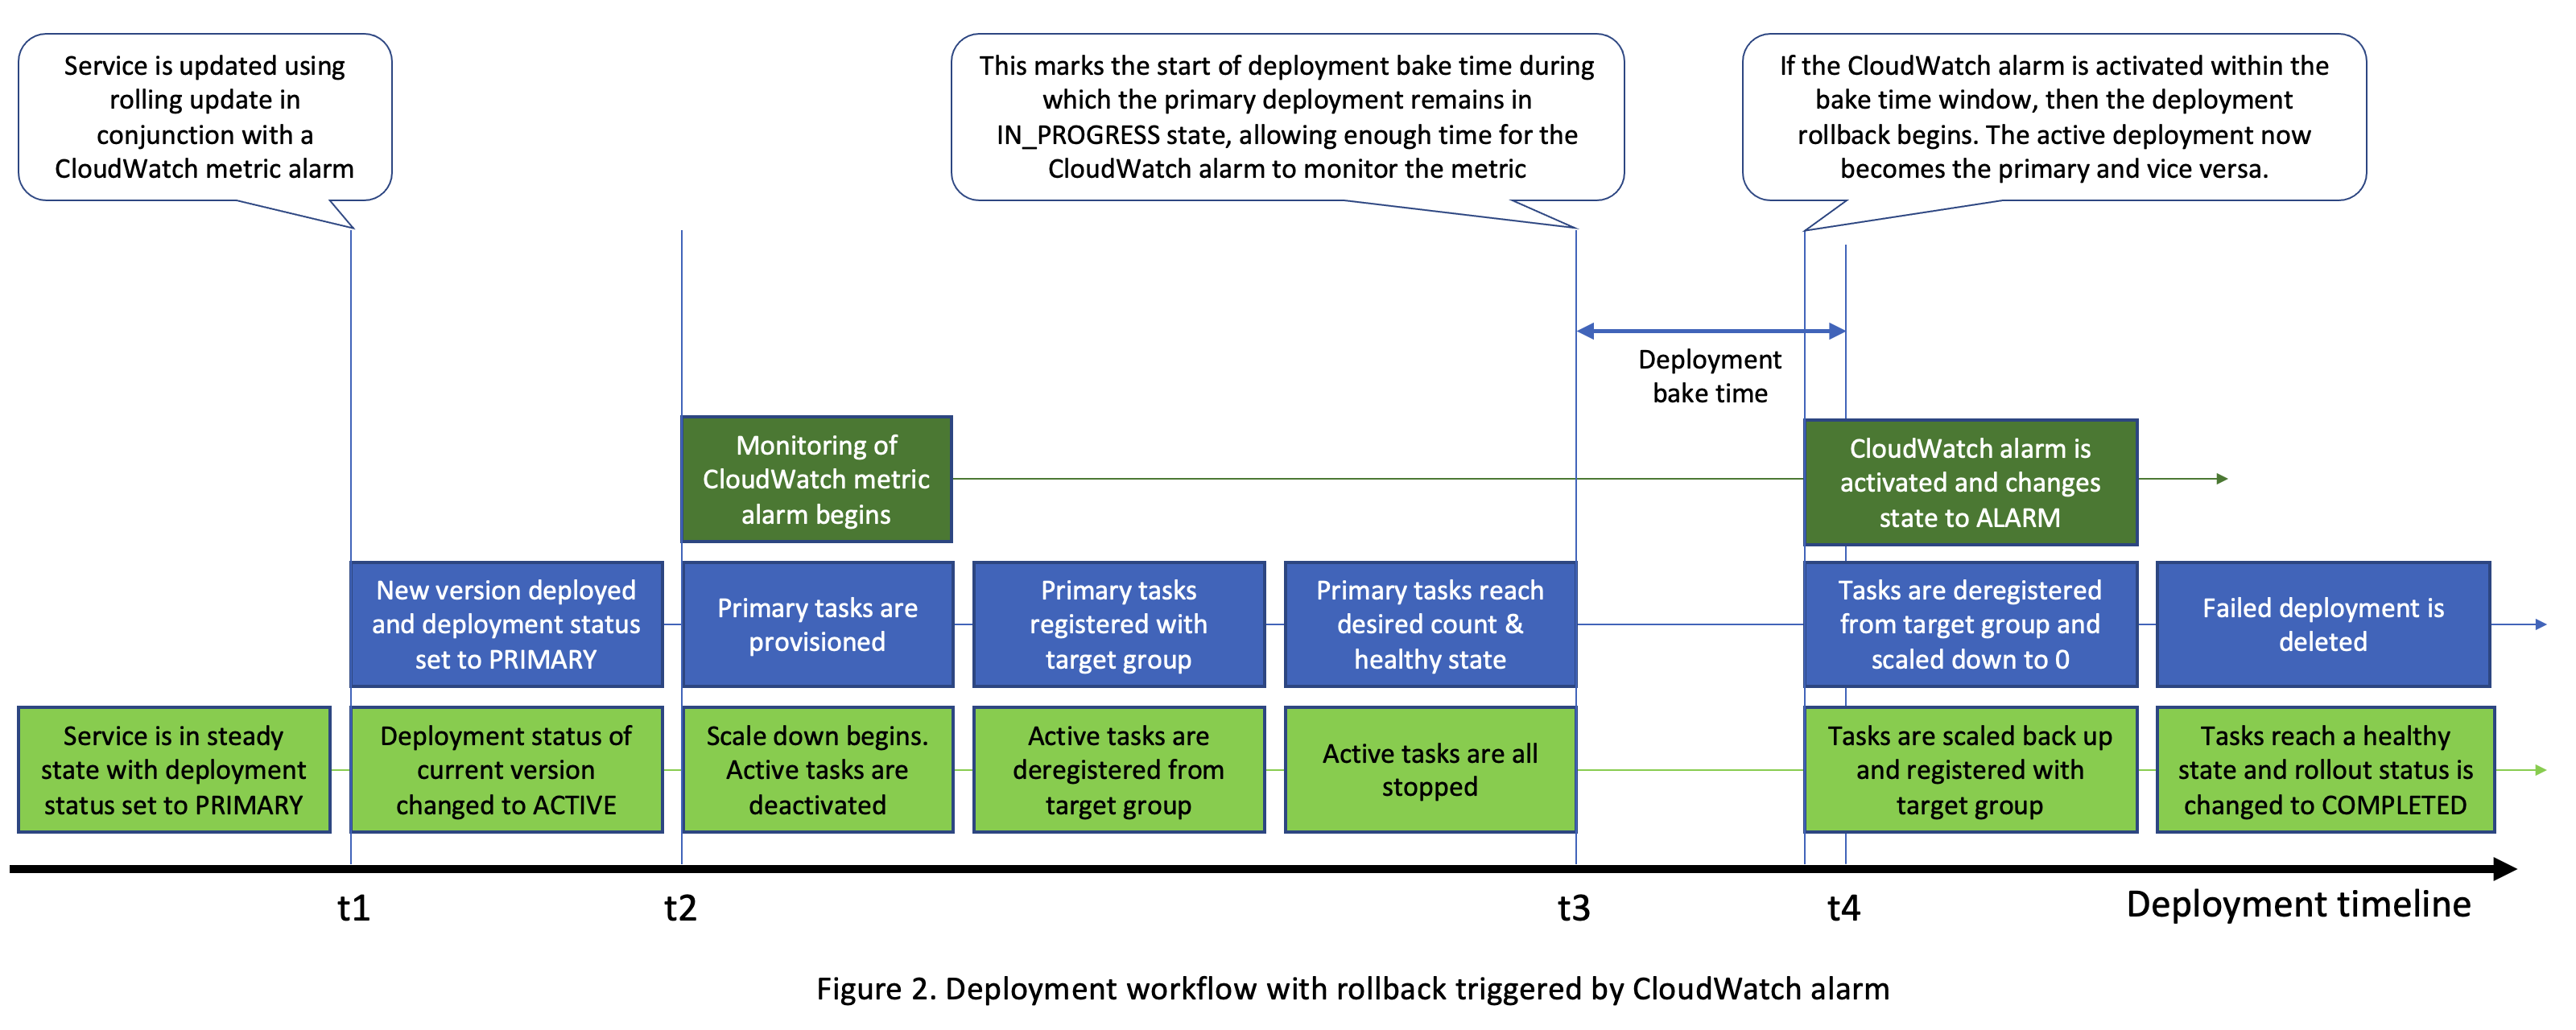
Referring to Figure 2 below, if an Amazon CloudWatch alarm is activated (i.e., state change from OK to ALARM) anytime between t = t2 and t = t4, Amazon ECS begins the rollback. The customer is notified about the failed deployment via the event bus and the status of current deployment is changed to FAILED. Also, what was previously the active deployment now becomes the primary and is scaled back up to the desired counts. The failed deployment is scaled down and ultimately deleted.
Rolling updates with alarms in action
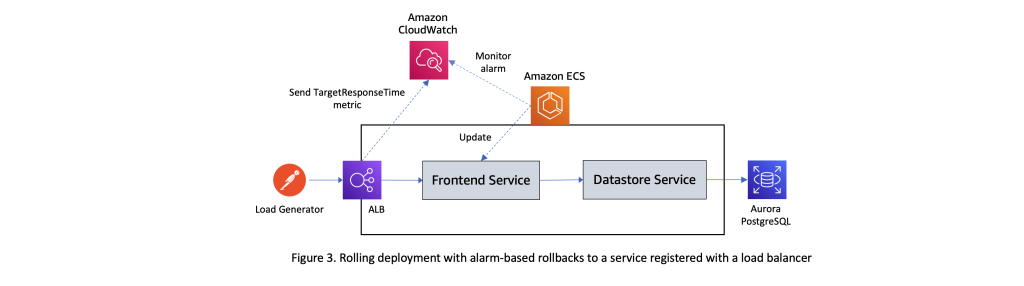
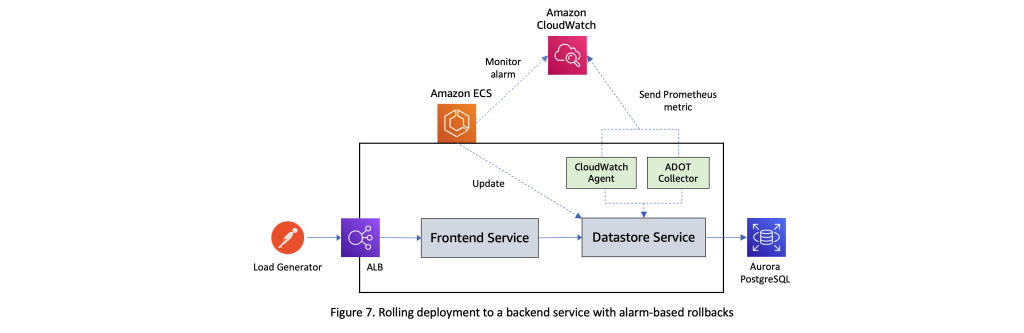
Let’s now test how rolling updates work in conjunction with Amazon CloudWatch alarms using a sample workload deployed to an Amazon ECS cluster. The illustration below in Figure 3 shows the setup employed for this test. It comprises a frontend service that exposes a set of REST APIs and interacts with a datastore service which in turn performs CRUD operations against an instance of Aurora PostgreSQL database. The tasks of the frontend service are registered with the target group attached to an Application Load Balancer. A steady stream of requests is sent to this workload using an external load generator. Elastic Load Balancing reports several metrics to Amazon CloudWatch that can be used to verify that the system is performing as expected. In this test, we are using the
TargetResponseTime
metric, which measures the time elapsed, in seconds, after the request leaves the load balancer until a response from the target is received.
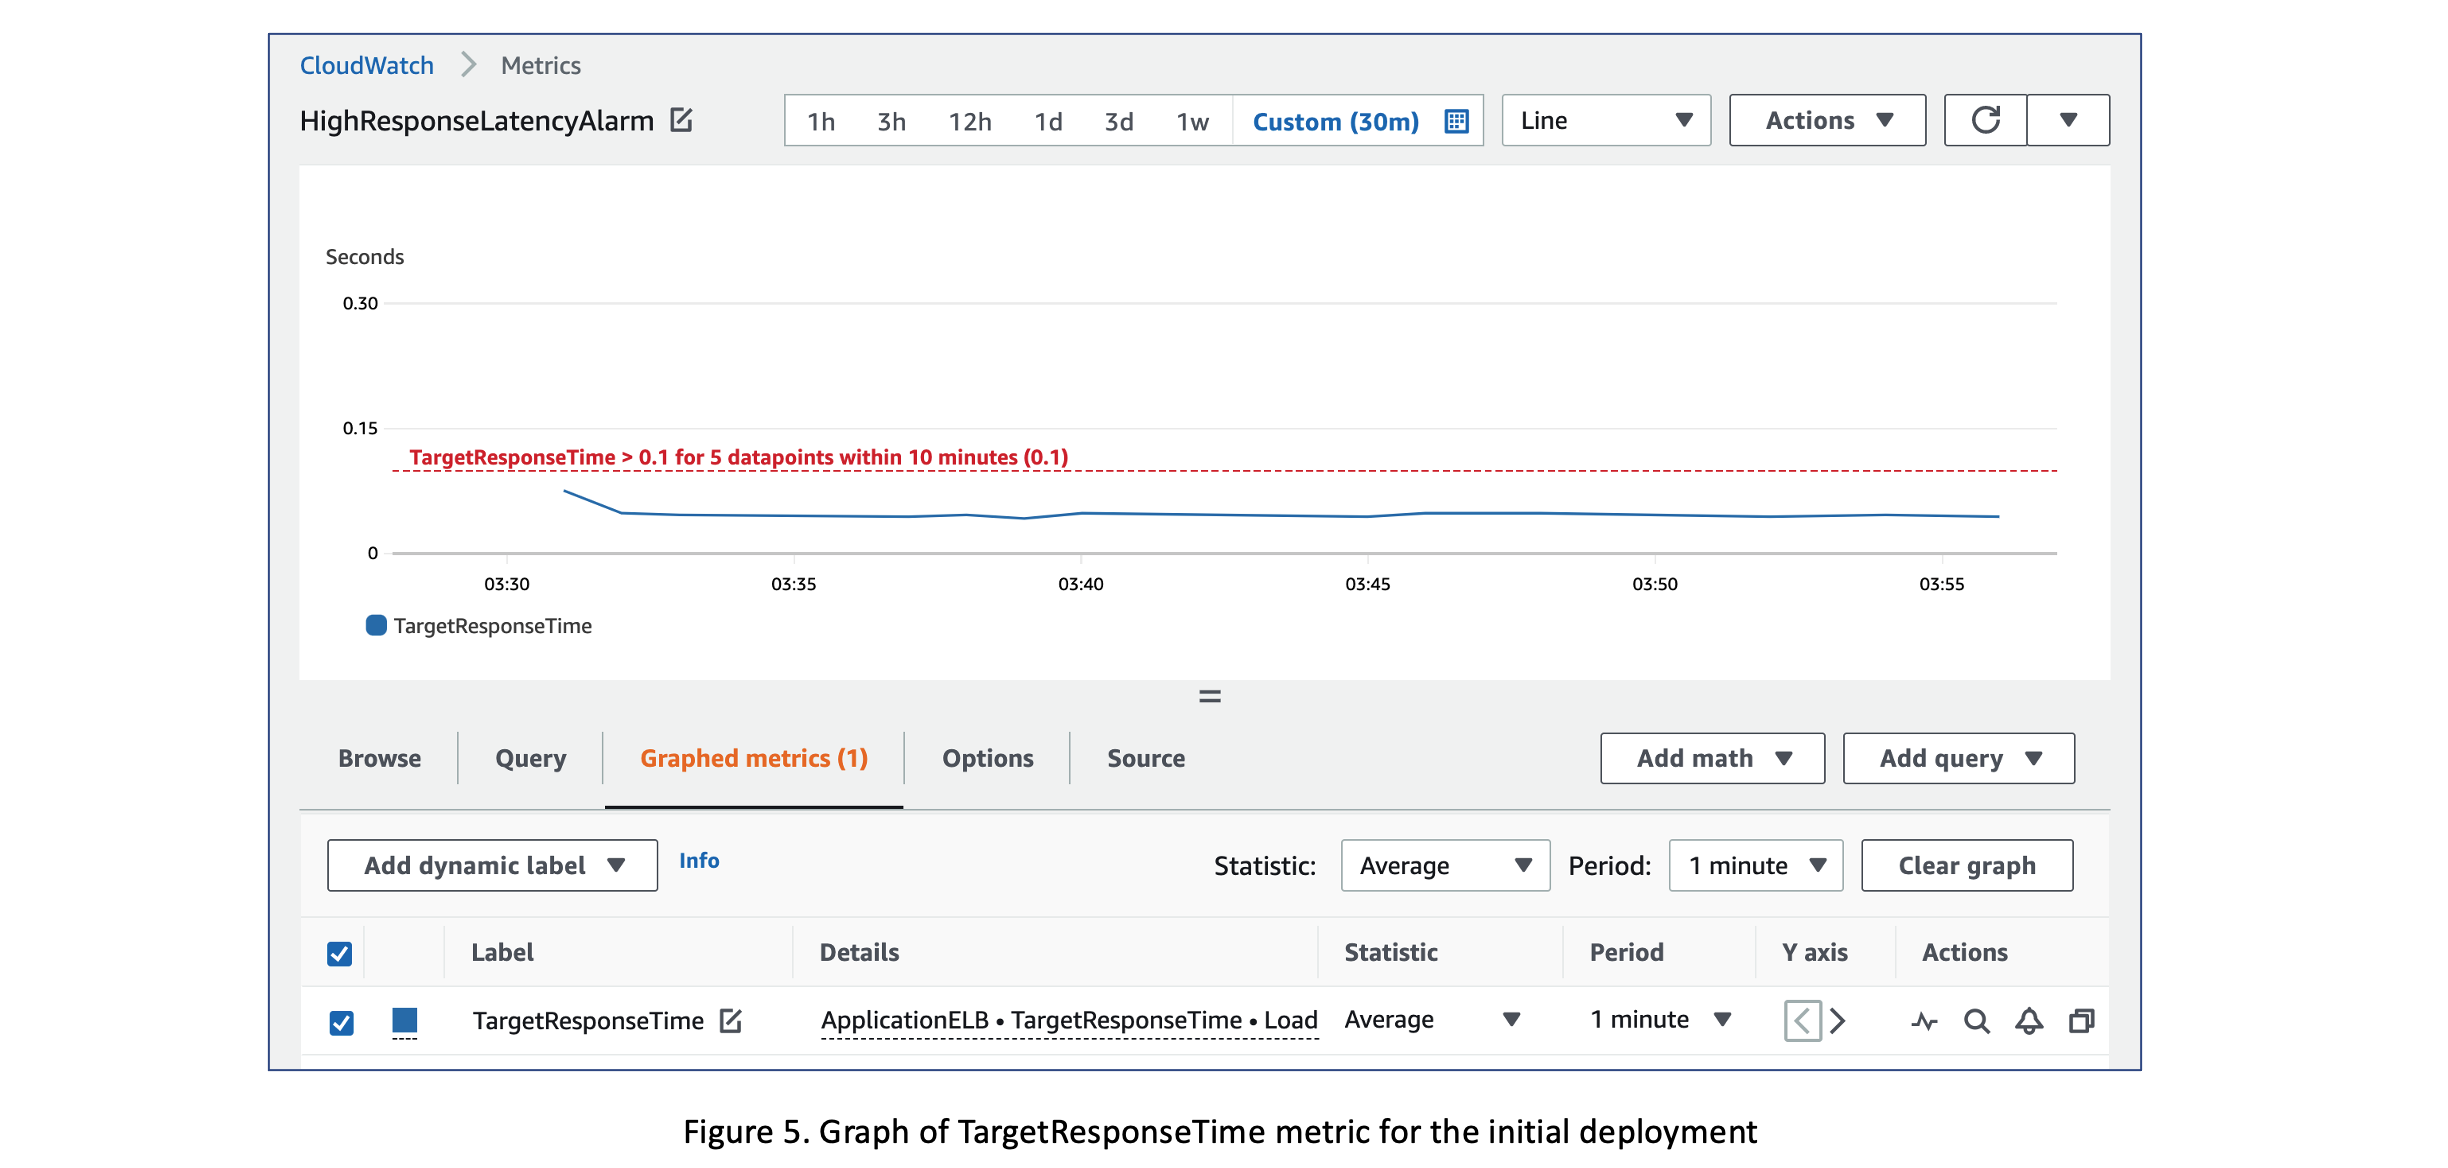
Details of the Amazon CloudWatch metric alarm created based on this metric are shown below. The alarm is configured to be activated if the
TargetResponseTime
metric breaches the threshold value of 0.1 seconds at least 5 times over a 10-minute interval.
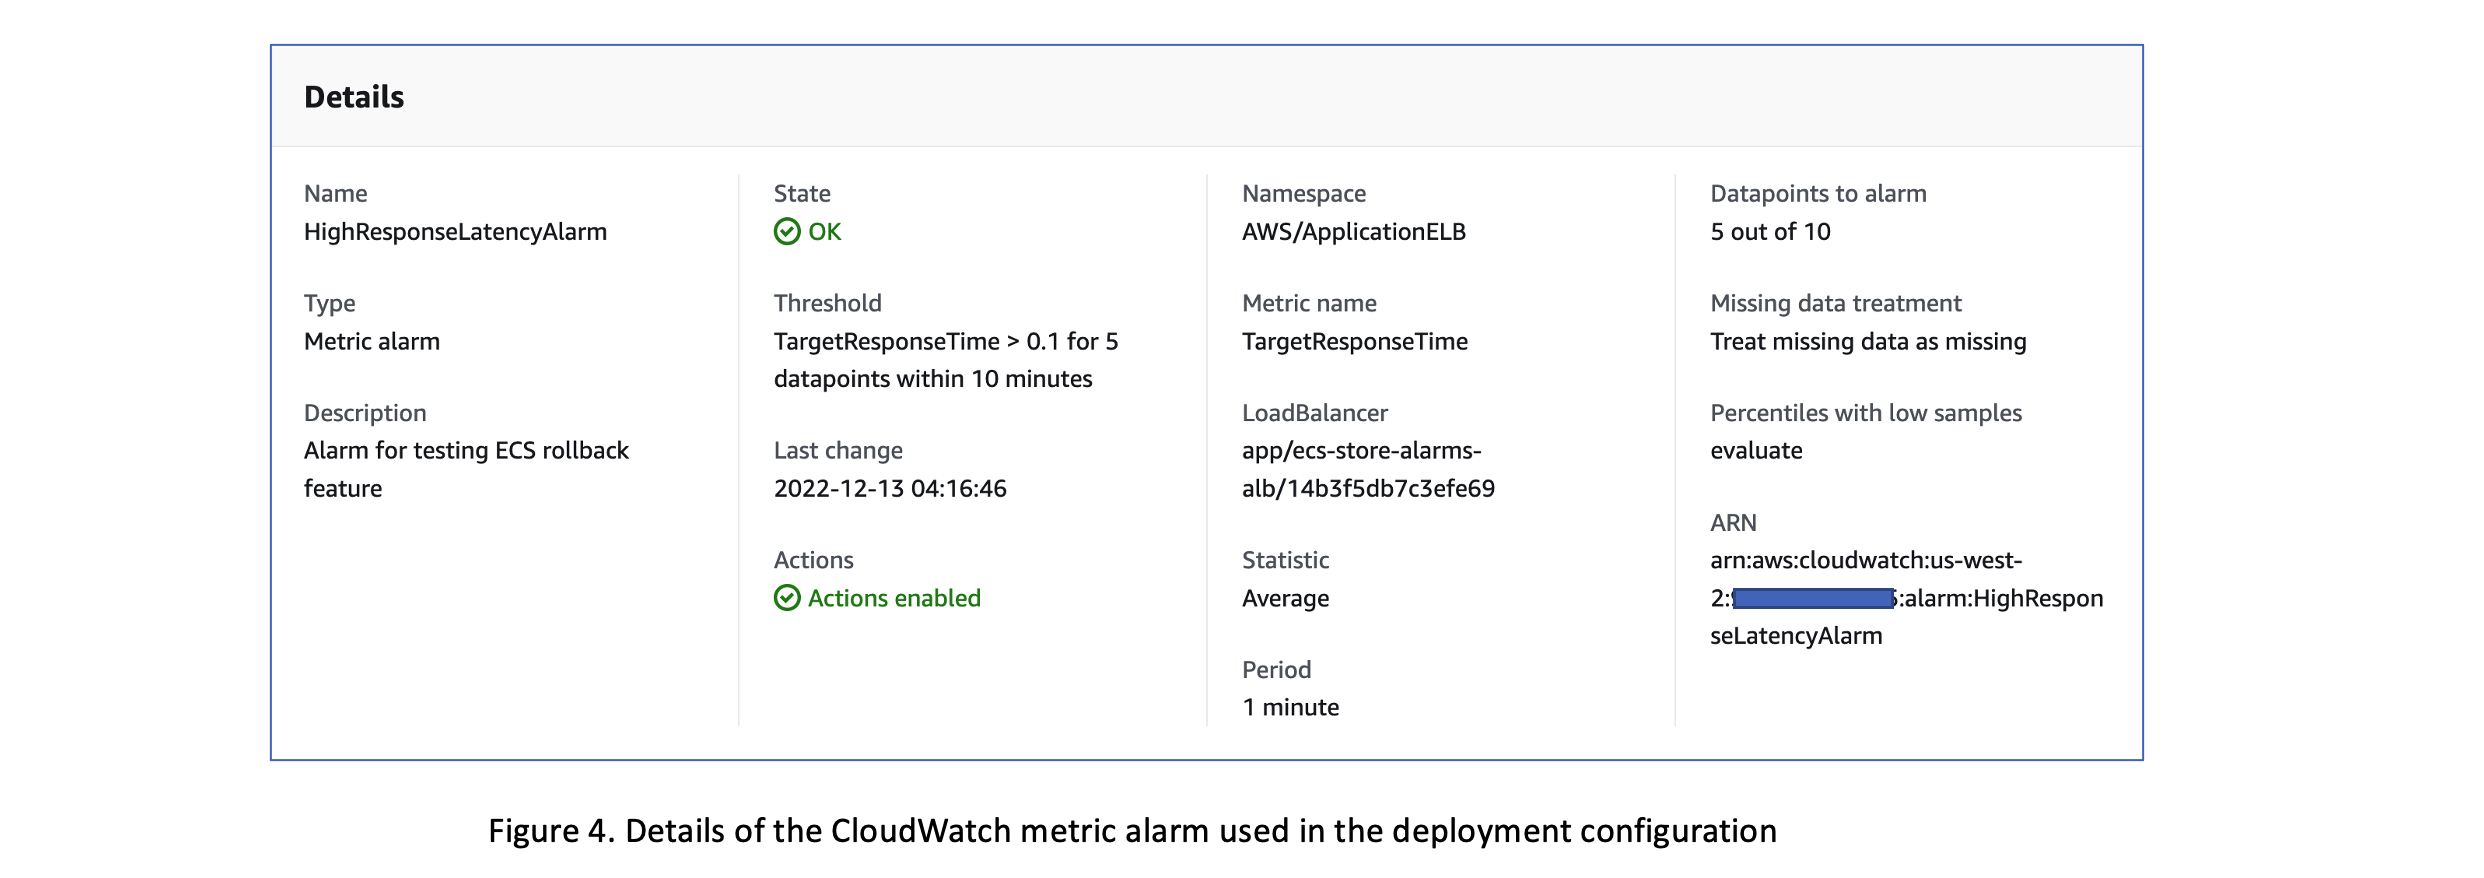
Figure 5 shows the graph of the
TargetResponseTime
metric, which averages around 50 milliseconds for the initial deployment of the frontend service.
A rolling update is now initiated with a newer revision of the frontend service. The application code for this revision has been modified so that the response time from the service exceeds the threshold value of 0.1 second configured for the Amazon CloudWatch metric alarm. The JSON data below shows the status of primary and active deployments sometime after the update was initiated. This juncture corresponds to t = t3 in the timeline in Figure 2 when the active deployment has been scaled down to 0 and the primary deployment has been scaled up to the desired count. In the JSON data, the task definition
FrontendAlarmTask:3
corresponds to the initial version of the service and
FrontendAlarmTask:4
is that of the updated version.
[
    {
        "id": "ecs-svc/1330173481524238954",
        "status": "PRIMARY",
        "taskDefinition": "arn:aws:ecs:us-west-2:XXX:task-definition/FrontendAlarmTask:4",
        "desiredCount": 2,
        "pendingCount": 0,
        "runningCount": 2,
        "failedTasks": 0,
        "createdAt": "2022-12-12T23:00:40.748000-05:00",
        "updatedAt": "2022-12-12T23:01:32.930000-05:00",
        "launchType": "EC2",
        "networkConfiguration": {
        },
        "rolloutState": "IN_PROGRESS",
        "rolloutStateReason": "ECS deployment ecs-svc/1330173481524238954 in progress."
    },
    {
        "id": "ecs-svc/7260558072093326498",
        "status": "ACTIVE",
        "taskDefinition": "arn:aws:ecs:us-west-2:XXX:task-definition/FrontendAlarmTask:3",
        "desiredCount": 0,
        "pendingCount": 0,
        "runningCount": 0,
        "failedTasks": 0,
        "createdAt": "2022-12-12T22:30:29.943000-05:00",
        "updatedAt": "2022-12-12T23:02:20.611000-05:00",
        "launchType": "EC2",
        "networkConfiguration": {
        },
        "rolloutState": "COMPLETED",
        "rolloutStateReason": "ECS deployment ecs-svc/7260558072093326498 completed."
    }
]
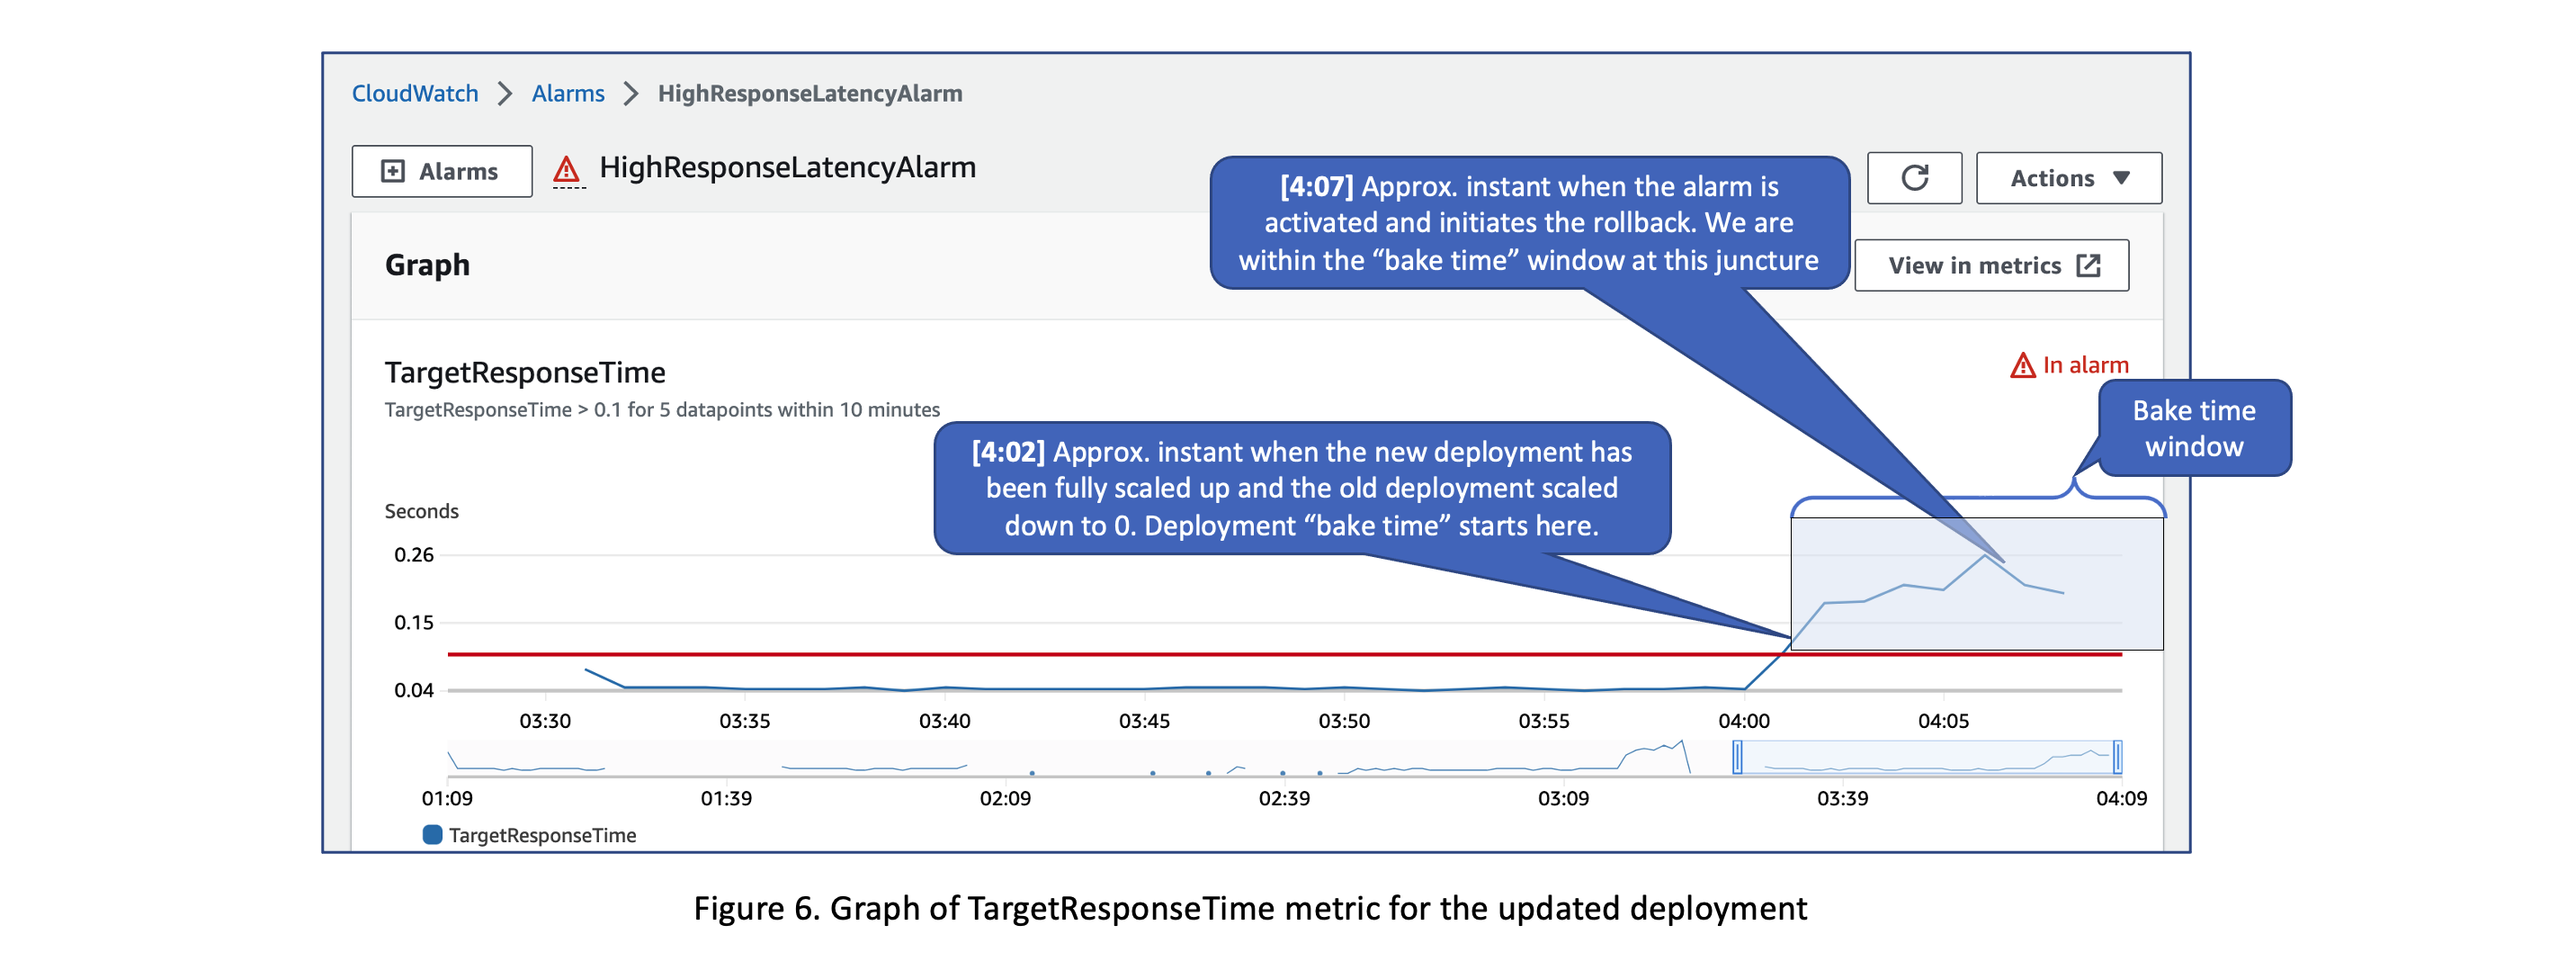
The Figure 6 shows a graph of the
TargetResponseTime
metric after the deployment was updated. It also points out the approximate instants when the deployment bake time starts and when the alarm is activated, initiating the rollback.
The JSON data below shows the status of primary and active deployments right after the rollback was initiated and the reason why the rollback was initiated.
[
    {
        "id": "ecs-svc/7260558072093326498",
        "status": "PRIMARY",
        "taskDefinition": "arn:aws:ecs:us-west-2:XXX:task-definition/FrontendAlarmTask:3",
        "desiredCount": 2,
        "pendingCount": 0,
        "runningCount": 2,
        "failedTasks": 0,
        "createdAt": "2022-12-12T22:30:29.943000-05:00",
        "updatedAt": "2022-12-12T23:08:22.484000-05:00",
        "launchType": "EC2",
        "networkConfiguration": {
        },
        "rolloutState": "IN_PROGRESS",
        "rolloutStateReason": "ECS deployment detected triggered alarm(s): rolling back to deploymentId ecs-svc/7260558072093326498."
    },
    {
        "id": "ecs-svc/1330173481524238954",
        "status": "ACTIVE",
        "taskDefinition": "arn:aws:ecs:us-west-2:XXX:task-definition/FrontendAlarmTask:4",
        "desiredCount": 0,
        "pendingCount": 0,
        "runningCount": 1,
        "failedTasks": 0,
        "createdAt": "2022-12-12T23:00:40.748000-05:00",
        "updatedAt": "2022-12-12T23:08:22.433000-05:00",
        "launchType": "EC2",
        "networkConfiguration": {
        },
        "rolloutState": "FAILED",
        "rolloutStateReason": "ECS deployment failed: alarm(s) detected."
    }
]
Rolling updates with alarms for backend services
The dynamics of managing a rolling update with alarms for a backend service (such as the datastore service in this sample scenario) that isn’t registered with a target group of a load balancer will be very similar. Note that as there won’t be any delays related to deregistration of tasks from a target group, the deployment is likely to reach the juncture that corresponds to t = t3 in Figure 2 much faster during these scenarios. However, as the deployment bake time starts only at t = t3, potential performance issues can still be surfaced up by monitoring appropriate Amazon CloudWatch alarms if you have implemented observability best practices into your microservices.
Customers can setup Amazon CloudWatch alarms based on any one of the
Conclusion
The blog discussed the details of automating the rollback of ECS rolling deployment using CloudWatch alarms. This feature is now generally available, and can be used via the Amazon Web Services CLI, Amazon Web Services SDK, or Amazon Web Services CloudFormation. We greatly value our customers feedback at Amazon, so please let us know how this new feature is working for you. We encourage you to submit any issues or questions to the containers public roadmap on
The mentioned AWS GenAI Services service names relating to generative AI are only available or previewed in the Global Regions. Amazon Web Services China promotes AWS GenAI Services relating to generative AI solely for China-to-global business purposes and/or advanced technology introduction.