许多跨国公司正在管理多个供应链,他们依靠这些业务不仅可以按时交付货物,还可以响应不同的客户和供应商需求。根据
麦肯锡的一项研究
,据估计,现在平均每3.7年发生一次严重的生产中断,这为首席执行官、董事会和投资者(而不仅仅是运营领导者)面临的供应链弹性问题增加了新的紧迫性。此外,该研究发现,由于供应链中断,每十年可能损失多达45%的一年收入。因此,通过全面的供应链可见性,您可以收集有关供应链网络的信息并将其存储在数据库中,从而实现端到端控制,从而提供诸如提高可见性、识别瓶颈和深入了解供应商等优势。
关系数据库
未针对涉及多个联接的非常复杂的查询或需要频繁更改架构时进行优化。 另一方面 ,
图形数据库
可以基于图表进行数据关联,并且非常适合将这些数据组织和可视化为一个集成的整体,因为它们直接代表网络。在
Amazon N
eptune上对高度互联的供应链数据进行图表分析为您提供了提出深层而复杂问题的工具,这些问题不仅可以理解单个数据点,还可以了解链中所有合作环节之间的关系。
在这篇文章中,我们将介绍如何使用 Neptune 图形数据库通过 Neptune
工作台
可视化供应链的相互关系 ,它允许您在完全托管的交互式开发环境中使用实时代码和叙述文本快速轻松地查询 Amazon Neptune 数据库,并识别产品、组件或供应商的所有直接和间接邻关系。
解决方案概述
在这篇文章中,我们考虑一家虚构的汽车制造公司,该公司制造各种类型和型号的汽车。
我们将介绍如何使用海王星通过海王星工作台使用Gremlin查询语言对该公司各种用例的供应链进行可视化和分析。
下图概述了这家虚构的汽车制造公司的各个组成部分是如何相互关联的。这概述了供应商组织和子公司与公司的关系、工厂和仓库的运营地点、制造汽车所需的各种产品以及它们与需求的关系。
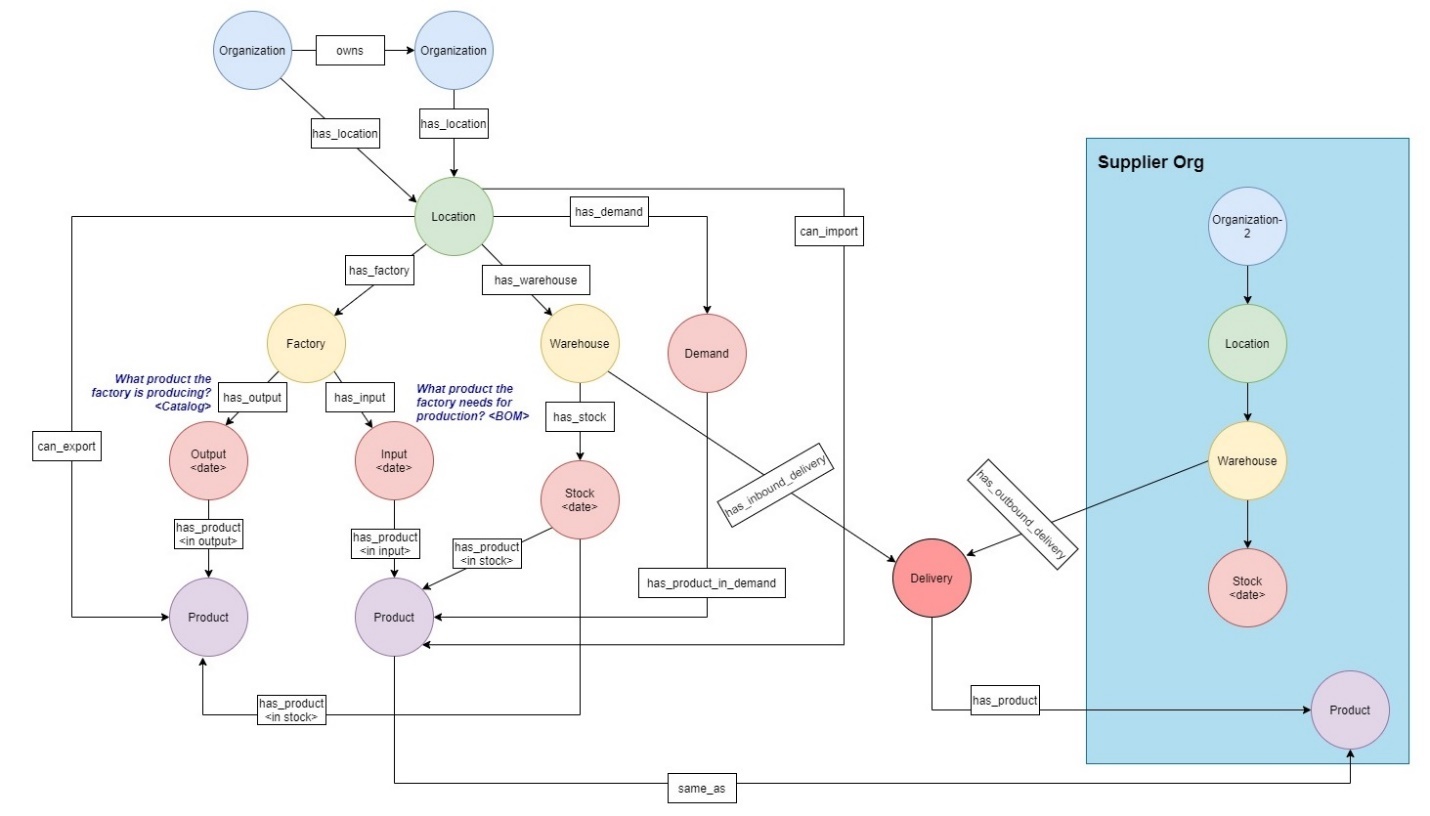
图 1:总体流量
通常,汽车制造公司可能有以下不同的数据类型:
-
包含文档、流程、设施、层次结构、系统和数据库等的组织数据
-
包含产品详细信息或物料清单 (BoM) 的产品数据
-
包含 CRM、企业数据等的客户数据
-
第三方数据,例如经销商数据、社交媒体和市场数据
-
事件数据,例如远程信息处理数据、客户连接或保修信息
-
供应链数据,例如供应商数据、库存数据或物流数据
在这篇文章中,我们使用与库存、BoM、设施和层次结构相关的数据。
先决条件
在本演练中,您应该具备以下先决条件:
-
一个
亚马逊云科技 账户
。
-
海王星数据库集群和
亚马逊 S ageMaker 笔记本
(海王星工作台)。
-
了解 Gremlin 和
Ju
pyter 笔记本电脑。
-
具有
使用 Neptune 数据库集群所需权限的 亚马逊云科技 身份和访问管理器
(IAM) 用户。有关更多信息,请参阅
创建具有 Nep tune 权限的 IAM 用户
。
在这篇文章中,我们使用了
us-east-1
区域。另请注意,客户应对此帖子的资源成本负责。
创建解决方案资源
为本文创建新的 Neptune 数据库集群和各种资源的最简单方法是使用
亚马逊云科技
CloudFormation 模板,该模板可为您创建所有必需的资源,而无需手动执行所有操作。 要启动新的预配置 Neptune 数据库集群,请完成以下步骤:
-
在
us-east-1 中启动 CloudFormation 堆栈 ,选择 La
unch
Stack(
此 CloudFormation 模板在 GitHub 存储库中可用)。

使用堆栈中的默认配置,假设集群和笔记本实例将运行 1 小时,估计费用约为每天 1 美元。定价详情可在
亚马逊 Nept
une 定价页面找到。
-
提供堆栈名称(例如,
demonepTunest
ack)。
-
对于
attachbulkloadiaMroletoneNeptuneCluster,选择 fal
se
-
保留 dbclusterP
ort 、db
replicaIdentifierSuffi
x 和 dbInst
anceType 的默认值。
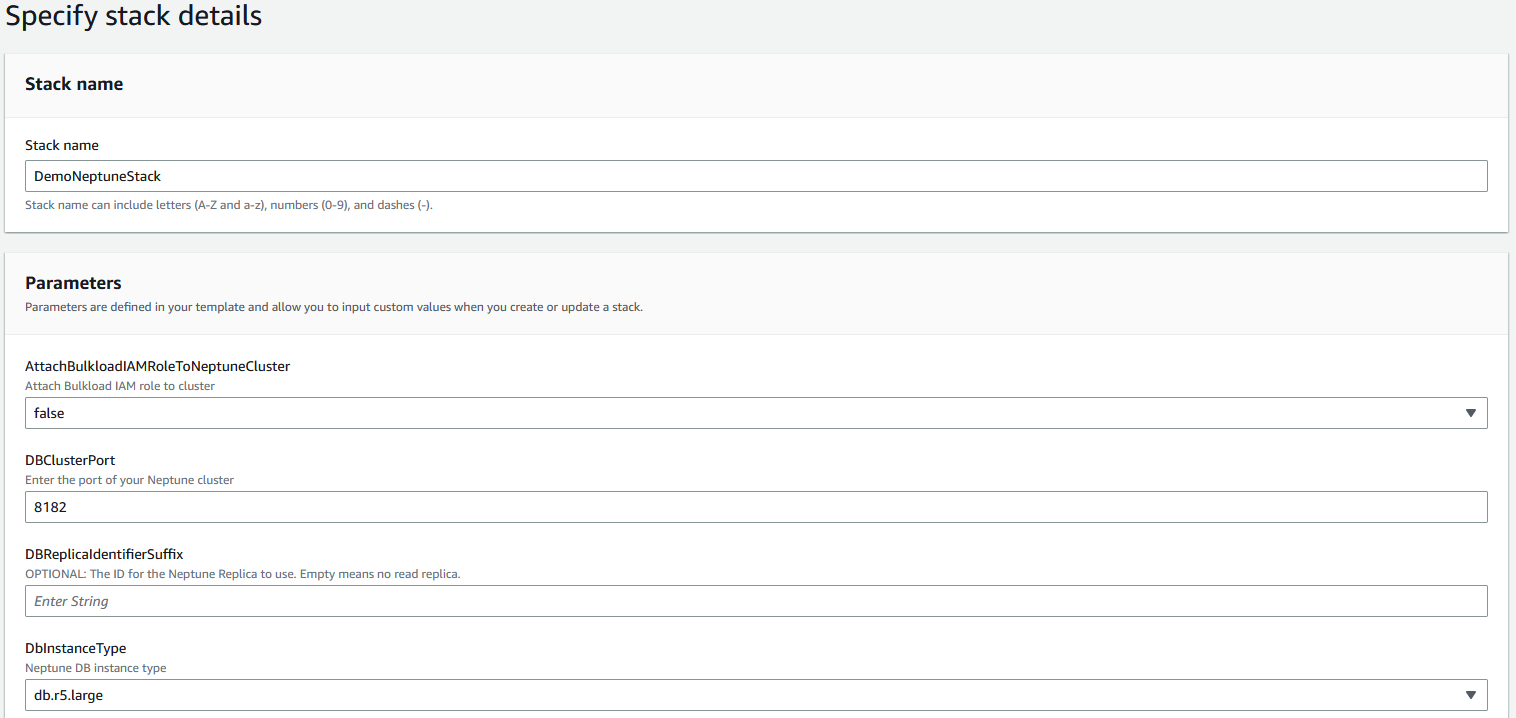
图 2:云端信息堆栈详情
-
对于
ENV
,输入 d
emos
cmblog。
-
保留
iamAuth Enab
led 、NeptuneenableAuditLog、NeptuneQueryTimeout 和 NeptunesageMakerNotebookStartupScript
的默认值。
-
对于
Notebook InstanceType,选择 ml.t3.xlarge
。
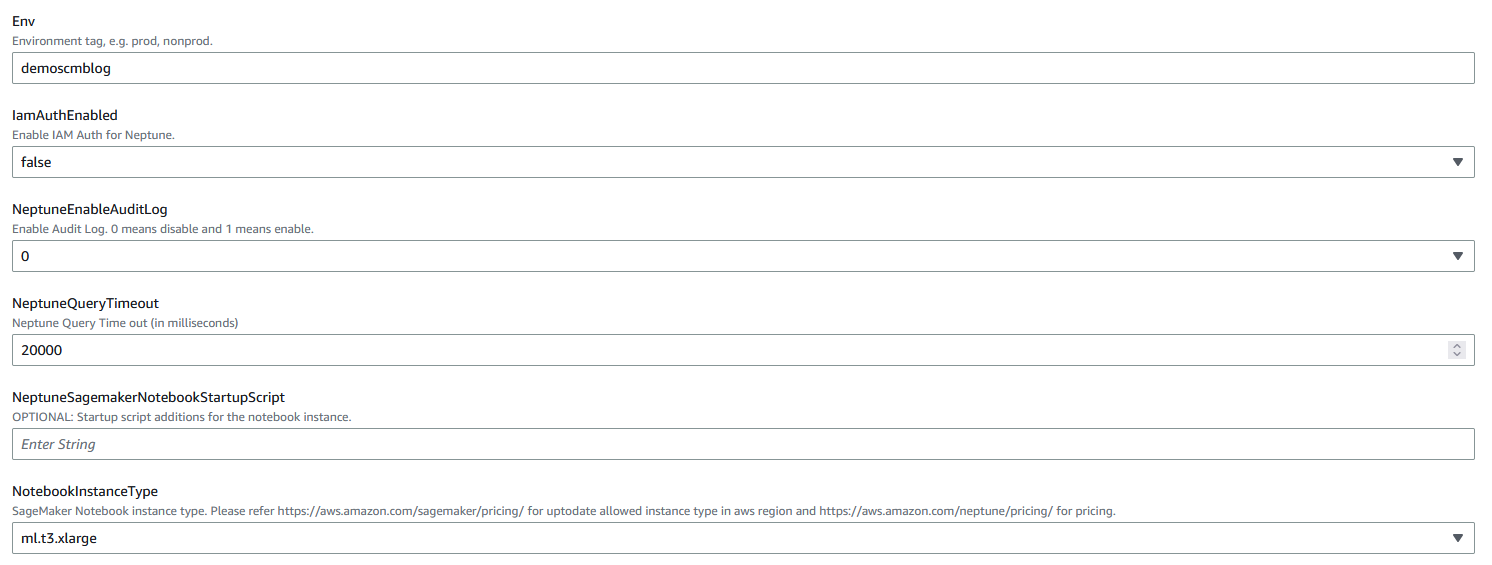
图 3:云端信息堆栈详情
-
完成堆栈创建。堆栈大约需要 15 — 20 分钟才能完成。
-
模板完成后,导航到堆栈的 O
ut
puts 选项卡,以获取您创建的资源的详细信息。
验证海王星集群和工作台
要验证 Neptune 集群和工作台,请完成以下步骤:
-
在
Neptune 控制台
上 , 在导航窗格中选择
数据库
。
此页面显示海王星集群的详细信息。集群应处于 “
可用
” 状态。

图 4:海王星集群状态
-
在导航窗格 中选择 “
笔记本
” 以获取与 Neptune 集群连接的笔记本的详细信息。
笔记本电脑必须处于 “就
绪
” 状态。
-
选择笔记本并在 “
操作
” 菜单上选择 “
打开 Jupyter
”。

图 5:打开 Jupyter
创建 Jupyter 笔记本
要创建 Jupyter 笔记本,请完成以下步骤:
-
打开笔记本并选择文件夹
Neptune
。

图 6:打开海王星文件夹
在
Neptune
文件夹中,有一些预先创建的带有示例笔记本的文件夹。
-
创建一个名为 d
emosc
mbLog 的文件夹。
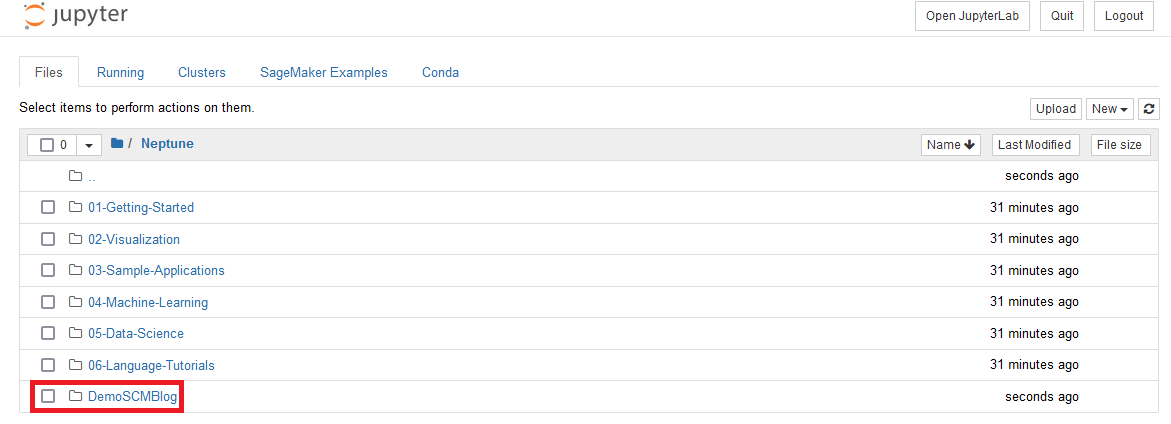
图 7:创建文件夹
-
在
demoscmbLog
文件夹内导航,选择 “
新
建” ,然后选择
Python 3
,使用 Python 3 和海王星内核创建 IPYNB 文件。
这将在浏览器中打开一个新选项卡。
-
重命名文件
演示数据分析
。

图 8:创建笔记本
该笔记本可在
GitHub 存储库
上下载。也可以通过单击 “上
传
” 按钮 Jupyter 将此笔记本导入到实例中。

图 9:上传笔记本
创建数据
在本节中,我们将创建分析所需的虚构数据。我们在这篇文章中使用小精灵魔法 (
%%grem
lin)。有关更多信息,请参阅在笔记本电脑中
使用 Neptune 工作台魔法。
请注意,使用图形数据库的关键组成部分是相应的数据模型。有关更多详细信息,请参阅
海王星图形数据模型
。
在本节中,我们将创建以下内容:
-
七家名为
Testco-
*的公司。
-
分析所需的各种设施、仓库和工厂。我们考虑各种类型的汽车,例如轿车和敞篷跑车,以及汽车的各种部件,例如前排座椅、后排座椅、加热装置、弹簧、钢制等。
完成以下步骤以创建示例数据:
-
创建各种公司、供应商和子公司:
%%gremlin
// create locations, suppliers, subsidiaries
g.addV('company').
  property(id, 'company-1').
  property('name', 'TestCo-1').
  addV('company').
  property(id, 'company-2').
  property('name', 'TestCo-2').
  addV('company').
  property(id, 'company-3').
  property('name', 'TestCo-3').
  addV('company').
  property(id, 'company-4').
  property('name', 'TestCo-4').
  addV('company').
  property(id, 'company-5').
  property('name', 'TestCo-5').
  addV('company').
  property(id, 'company-6').
  property('name', 'TestCo-6').
  addV('company').
  property(id, 'company-7').
  property('name', 'TestCo-7').
  next()
-
添加地点、仓库、工厂、产品和库存信息:
%%gremlin

//add locations, warehouses, factories, products, stocks

g
    // locations
    .addV('location').property(id, 'company-2-location-1').property('name', 'Facility-1')
    .addV('location').property(id, 'company-2-location-2').property('name', 'Facility-2')
    .addV('location').property(id, 'company-5-location-1').property('name', 'Facility-3')
    .addV('location').property(id, 'company-5-location-2').property('name', 'Facility-4')
    .addV('location').property(id, 'company-6-location-1').property('name', 'Facility-5')
    .addV('location').property(id, 'company-7-location-1').property('name', 'Facility-6')

    // warehouses
    .addV('warehouse').property(id, 'company-2-location-1-warehouse').property('name', 'Warehouse-1')
    .addV('warehouse').property(id, 'company-2-location-2-warehouse').property('name', 'Warehouse-2')
    .addV('warehouse').property(id, 'company-5-location-1-warehouse').property('name', 'Warehouse-3')
    .addV('warehouse').property(id, 'company-5-location-2-warehouse').property('name', 'Warehouse-4')
    .addV('warehouse').property(id, 'company-6-location-1-warehouse').property('name', 'Warehouse-5')
    .addV('warehouse').property(id, 'company-7-location-1-warehouse').property('name', 'Warehouse-6')

    // factories
    .addV('factory').property(id, 'company-2-location-1-factory').property('name', 'Factory-1')
    .addV('factory').property(id, 'company-2-location-2-factory').property('name', 'Factory-2')
    .addV('factory').property(id, 'company-5-location-1-factory').property('name', 'Factory-3')
    .addV('factory').property(id, 'company-5-location-2-factory').property('name', 'Factory-4')
    .addV('factory').property(id, 'company-6-location-1-factory').property('name', 'Factory-5')
    .addV('factory').property(id, 'company-7-location-1-factory').property('name', 'Factory-6')

    // products
    .addV('product').property(id, 'company-2-product-1').property('name', 'Sedan Car')
    .addV('product').property(id, 'company-2-product-2').property('name', 'SUV Car')
    .addV('product').property(id, 'company-5-product-1').property('name', 'Front Seat')
    .addV('product').property(id, 'company-5-product-2').property('name', 'Rear Seat')
    .addV('product').property(id, 'company-5-product-3').property('name', 'Bench Seat')
    .addV('product').property(id, 'company-6-product-1').property('name', 'Springs')
    .addV('product').property(id, 'company-6-product-2').property('name', 'Heating')
    .addV('product').property(id, 'company-7-product-1').property('name', 'Steel')

    // stocks
    .addV('stock').property(id, 'company-2-location-1-warehouse-stock-1').property('date', datetime('2022-08-01'))
    .addV('stock').property(id, 'company-2-location-1-warehouse-stock-2').property('date', datetime('2022-08-02'))
    .addV('stock').property(id, 'company-7-location-1-warehouse-stock-1').property('date', datetime('2022-08-01'))
    .addV('stock').property(id, 'company-7-location-1-warehouse-stock-2').property('date', datetime('2022-08-02'))
    .next()
-
验证创建的公司数量(应该是七个):
%%gremlin

// check number of companies
g.V().hasLabel('company').count()
-
验证创建的产品总数(应为八个):
%%gremlin

// check the total number of products
g.V().hasLabel('product').count()
在数据中添加关系
在本节中,我们开始创建不同节点之间的关系,为汽车公司创建供应链网络。
添加公司所有权结构
我们想增加公司所有权结构。为此,我们需要创造优势,将公司与其子公司联系起来。在这里,我们增加了所有权类型的
优势
,它根据所有权结构将公司联系起来。这本质上表示一家公司拥有另一家公司或与另一家公司有关系。参见以下代码:
%%gremlin

g.addE('owns').from(__.V('company-1')).to(__.V('company-2')).
  addE('owns').from(__.V('company-1')).to(__.V('company-3')).
  addE('owns').from(__.V('company-4')).to(__.V('company-5')).
  next()
          前面的查询创建了两家公司之间的所有权结构,其中

           Testco-1 拥有testCo- 2 和Test


           Co- 3,而Testco-4


           拥有TestCo-5

          。
现在让我们使用以下查询在工作台中可视化这个结构:
%%gremlin -p v,oute,inv

g.V().outE().inV().path().by('name').by(label())
此查询在输出的 “
图
形 ” 选项卡上创建了以下图形描述。
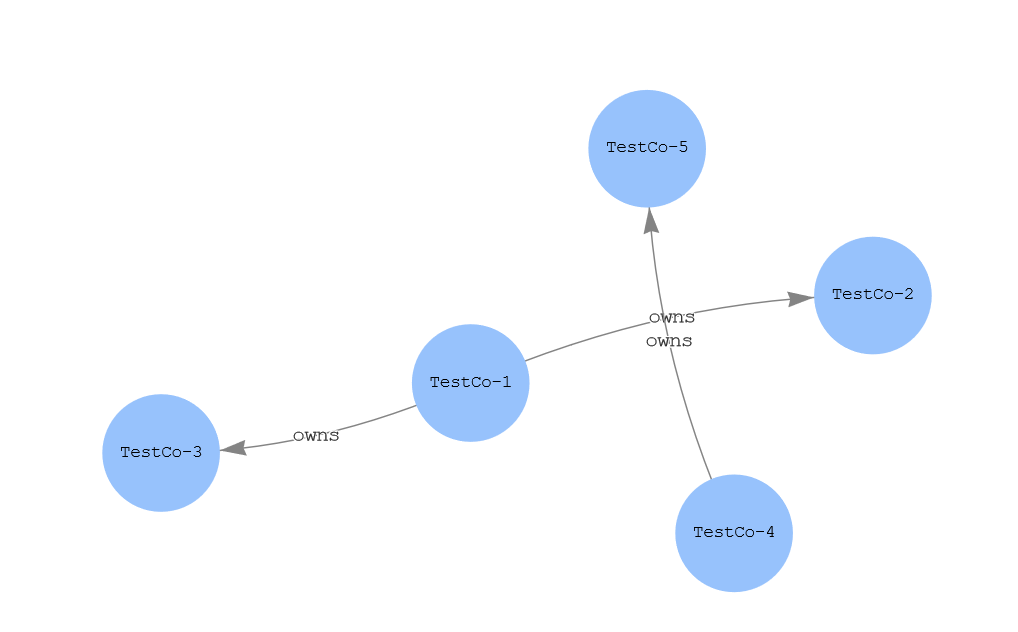
图 10:公司所有权
在工厂、仓库、产品和库存之间建立关系
为了为虚构的汽车公司创建供应链图,我们在以下两者之间创建了关系:
-
连接到地点(设施)的公司
-
与仓库相连的地点
-
与工厂相连的地点
-
目录中包含产品的公司
-
产品之间的关系,描述其材料、数量等
-
不同日期在仓库中的产品库存
-
产品与库存之间的关系
使用以下查询来创建这些关系:
%%gremlin

g.addE('has_location').
    from(__.V('company-2')).
    to(__.V('company-2-location-1')).
  addE('has_location').
    from(__.V('company-2')).
    to(__.V('company-2-location-2')).
  addE('has_location').
    from(__.V('company-5')).
    to(__.V('company-5-location-1')).
  addE('has_location').
    from(__.V('company-5')).
    to(__.V('company-5-location-2')).
  addE('has_location').
    from(__.V('company-6')).
    to(__.V('company-6-location-1')).
  addE('has_location').
    from(__.V('company-7')).
    to(__.V('company-7-location-1')).
  addE('has_warehouse').
    from(__.V('company-2-location-1')).
    to(__.V('company-2-location-1-warehouse')).
  addE('has_warehouse').
    from(__.V('company-2-location-2')).
    to(__.V('company-2-location-2-warehouse')).
  addE('has_warehouse').
    from(__.V('company-5-location-1')).
    to(__.V('company-5-location-1-warehouse')).
  addE('has_warehouse').
    from(__.V('company-5-location-2')).
    to(__.V('company-5-location-2-warehouse')).
  addE('has_warehouse').
    from(__.V('company-6-location-1')).
    to(__.V('company-6-location-1-warehouse')).
  addE('has_warehouse').
    from(__.V('company-7-location-1')).
    to(__.V('company-7-location-1-warehouse')).
  addE('has_factory').
    from(__.V('company-2-location-1')).
    to(__.V('company-2-location-1-factory')).
  addE('has_factory').
    from(__.V('company-2-location-2')).
    to(__.V('company-2-location-2-factory')).
  addE('has_factory').
    from(__.V('company-5-location-1')).
    to(__.V('company-5-location-1-factory')).
  addE('has_factory').
    from(__.V('company-5-location-2')).
    to(__.V('company-5-location-2-factory')).
  addE('has_factory').
    from(__.V('company-6-location-1')).
    to(__.V('company-6-location-1-factory')).
  addE('has_factory').
    from(__.V('company-7-location-1')).
    to(__.V('company-7-location-1-factory')).
  addE('has_in_catalog').
    from(__.V('company-2')).
    to(__.V('company-2-product-1')).
  addE('has_in_catalog').
    from(__.V('company-2')).
    to(__.V('company-2-product-2')).
  addE('has_in_catalog').
    from(__.V('company-5')).
    to(__.V('company-5-product-1')).
  addE('has_in_catalog').
    from(__.V('company-5')).
    to(__.V('company-5-product-2')).
  addE('has_in_catalog').
    from(__.V('company-5')).
    to(__.V('company-5-product-3')).
  addE('has_in_catalog').
    from(__.V('company-6')).
    to(__.V('company-6-product-1')).
  addE('has_in_catalog').
    from(__.V('company-6')).
    to(__.V('company-6-product-2')).
  addE('has_in_catalog').
    from(__.V('company-7')).
    to(__.V('company-7-product-1')).
  addE('made_of').
    from(__.V('company-2-product-1')).
    to(__.V('company-5-product-1')).
  property('unit', 'PC').
  property('qty', 2).
  addE('made_of').
    from(__.V('company-2-product-2')).
    to(__.V('company-5-product-1')).
  property('unit', 'PC').
  property('qty', 2).
  addE('made_of').
    from(__.V('company-2-product-1')).
    to(__.V('company-7-product-1')).
  property('unit', 'KG').
  property('qty', 123.45).
  addE('made_of').
    from(__.V('company-2-product-2')).
    to(__.V('company-5-product-1')).
  property('unit', 'KG').
  property('qty', 123.45).
  addE('made_of').
    from(__.V('company-2-product-1')).
    to(__.V('company-5-product-2')).
  property('unit', 'PC').
  property('qty', 3).
  addE('made_of').
    from(__.V('company-2-product-2')).
    to(__.V('company-5-product-2')).
  property('unit', 'PC').
  property('qty', 3).
  addE('made_of').
    from(__.V('company-2-product-2')).
    to(__.V('company-5-product-3')).
  property('unit', 'PC').
  property('qty', 2).
  addE('made_of').
    from(__.V('company-5-product-1')).
    to(__.V('company-6-product-1')).
  property('unit', 'PC').
  property('qty', 1).
  addE('made_of').
    from(__.V('company-5-product-2')).
    to(__.V('company-6-product-1')).
  property('unit', 'PC').
  property('qty', 1).
  addE('made_of').
    from(__.V('company-5-product-3')).
    to(__.V('company-6-product-1')).
  property('unit', 'PC').
  property('qty', 1).
  addE('made_of').
    from(__.V('company-5-product-1')).
    to(__.V('company-6-product-2')).
  property('unit', 'PC').
  property('qty', 1).
  addE('made_of').
    from(__.V('company-5-product-2')).
    to(__.V('company-6-product-2')).
  property('unit', 'PC').
  property('qty', 1).
  addE('made_of').
    from(__.V('company-5-product-3')).
    to(__.V('company-6-product-2')).
  property('unit', 'PC').
  property('qty', 1).
  addE('made_of').
    from(__.V('company-6-product-1')).
    to(__.V('company-7-product-1')).
  property('unit', 'KG').
  property('qty', 0.12).
  addE('made_of').
    from(__.V('company-6-product-2')).
    to(__.V('company-7-product-1')).
  property('unit', 'KG').
  property('qty', 3.4).
  addE('has_stock').
    from(__.V('company-2-location-1-warehouse')).
    to(__.V('company-2-location-1-warehouse-stock-1')).
  property('date', datetime('2022-08-01')).
  addE('has_stock').
    from(__.V('company-2-location-1-warehouse')).
    to(__.V('company-2-location-1-warehouse-stock-2')).
  property('date', datetime('2022-08-02')).
  addE('has_stock').
    from(__.V('company-7-location-1-warehouse')).
    to(__.V('company-7-location-1-warehouse-stock-1')).
  property('date', datetime('2022-08-01')).
  addE('has_stock').
    from(__.V('company-7-location-1-warehouse')).
    to(__.V('company-7-location-1-warehouse-stock-2')).
  property('date', datetime('2022-08-02')).
  addE('has_product_in_stock').
    from(__.V('company-2-location-1-warehouse-stock-1')).
    to(__.V('company-2-product-1')).
  property('unit', 'PC').
  property('qty', 10).
  property('date', datetime('2022-08-01')).
  addE('has_product_in_stock').
    from(__.V('company-2-location-1-warehouse-stock-1')).
    to(__.V('company-2-product-2')).
  property('unit', 'PC').
  property('qty', 4).
  property('date', datetime('2022-08-01')).
  addE('has_product_in_stock').
    from(__.V('company-2-location-1-warehouse-stock-2')).
    to(__.V('company-2-product-1')).
  property('unit', 'PC').
  property('qty', 2).
  property('date', datetime('2022-08-02')).
  addE('has_product_in_stock').
    from(__.V('company-2-location-1-warehouse-stock-2')).
    to(__.V('company-2-product-2')).
  property('unit', 'PC').
  property('qty', 0).
  property('date', datetime('2022-08-02')).
  addE('has_product_in_stock').
    from(__.V('company-7-location-1-warehouse-stock-1')).
    to(__.V('company-7-product-1')).
  property('unit', 'KG').
  property('qty', 123.45).
  property('date', datetime('2022-08-01')).
  addE('has_product_in_stock').
    from(__.V('company-7-location-1-warehouse-stock-2')).
    to(__.V('company-7-product-1')).
  property('unit', 'KG').
  property('qty', 0).
  property('date', datetime('2022-08-02'))
可视化整体图表
现在,让我们可视化整个图表以及供应链中各元素之间的各种连通性。在这里,我们可以看到以下内容之间的连接:
-
一家公司(例如
TestCo-6
)有设施的所在地,而该地点有仓库和工厂。
-
与公司相关的产品目录。这些产品由其他产品制成,而其他产品又是其他公司的目录。
以下查询显示了此用例的连接图:
%%gremlin -p v,oute,inv

g.V().outE().inV().path().by(elementMap())
该查询生成了下图,该图表显示了该供应链的整体连通性。
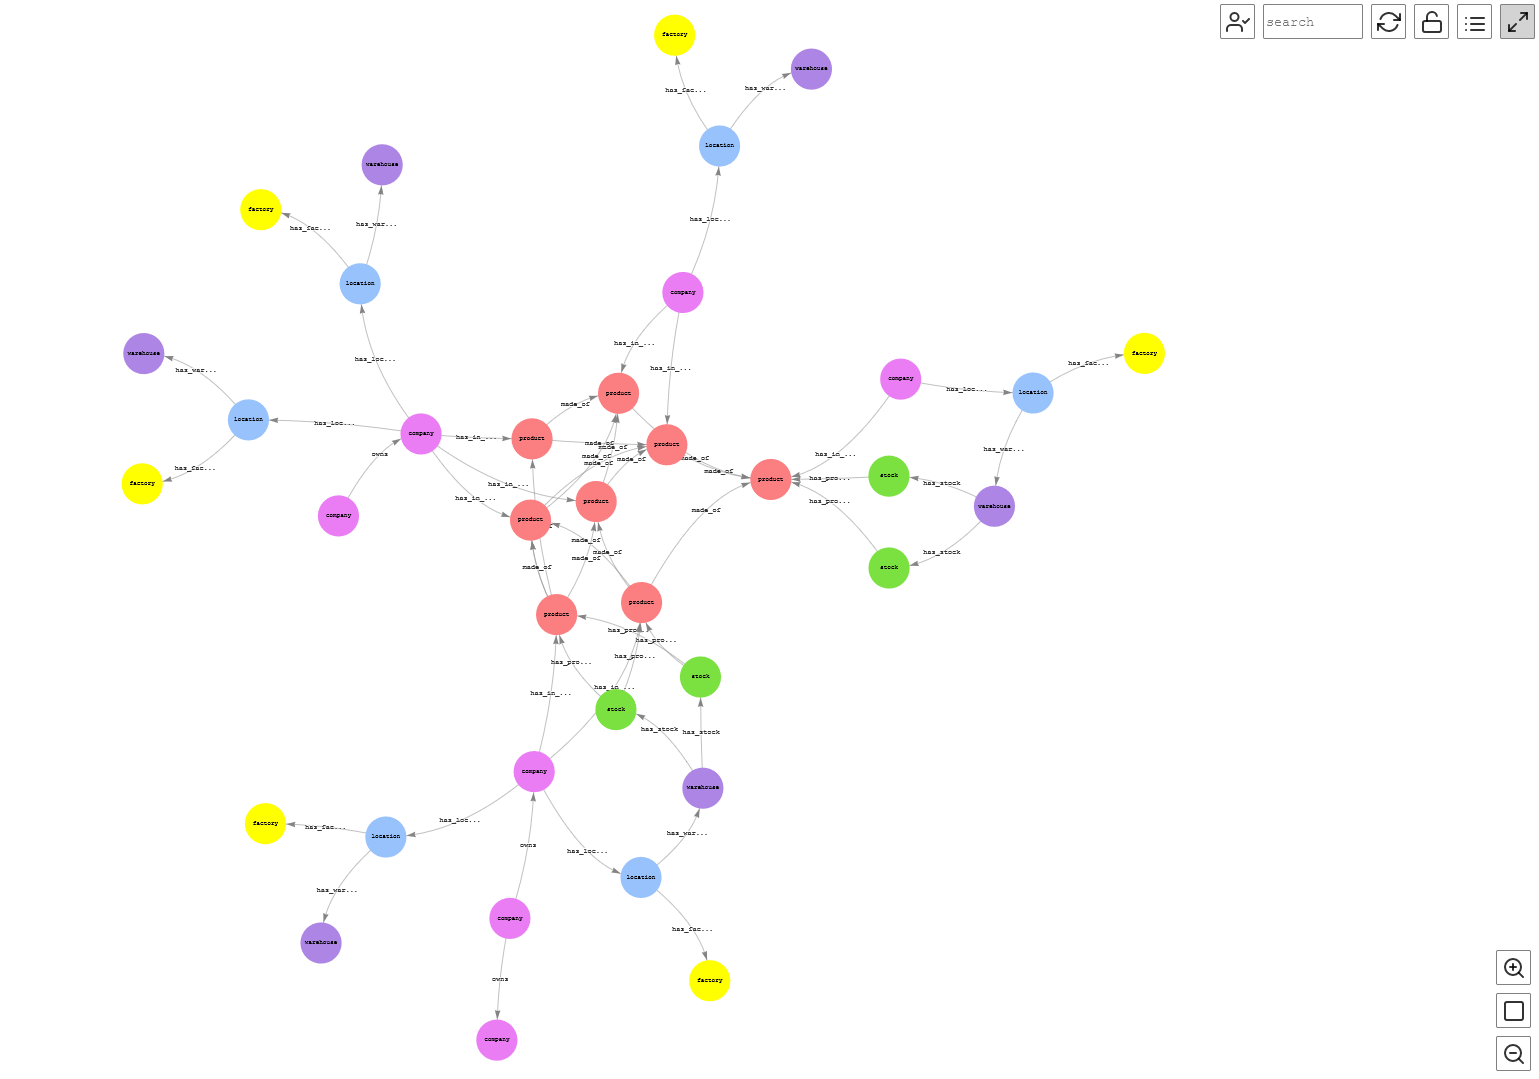
图 11:完整图表
关键关键关键绩效指标的图形遍历
在本节中,我们遍历了前几节中创建的虚构汽车公司的供应链图,并开始获得一些可操作的关键绩效指标。我们对以下内容感兴趣:
-
汽车的物料清单
-
汽车由各种部件构成
-
所有仓库中特定车型的库存
找到汽车的物料清单
关键组成部分是获取特定产品的
物料清单 (BOM)
。 它可以定义产品的设计、订购、制造或维护。这本质上是产品的配方。因此,例如,为了获得这篇文章的汽车物料清单,我们对示例数据运行以下查询。在此示例中,我们正在研究轿车的物料清单、该车由什么制成(例如座椅和钢材)以及相应的可用数量。此查询遍历创建的图表以获取特定产品的详细信息。
%%gremlin -p v,oute,inv,oute,inv,oute,inv,oute,inv

// get BoM

g.V().
  has('name', 'Sedan Car').as('product').
  outE('made_of').
  inV().as('material').
  path().by('name').by('qty')
以下是工作台中可用查询的图形表示。该图显示
轿车
由
前排座椅 、 后排座
椅
和
钢制
等部件组成 ,还显示了相应的组件数量。
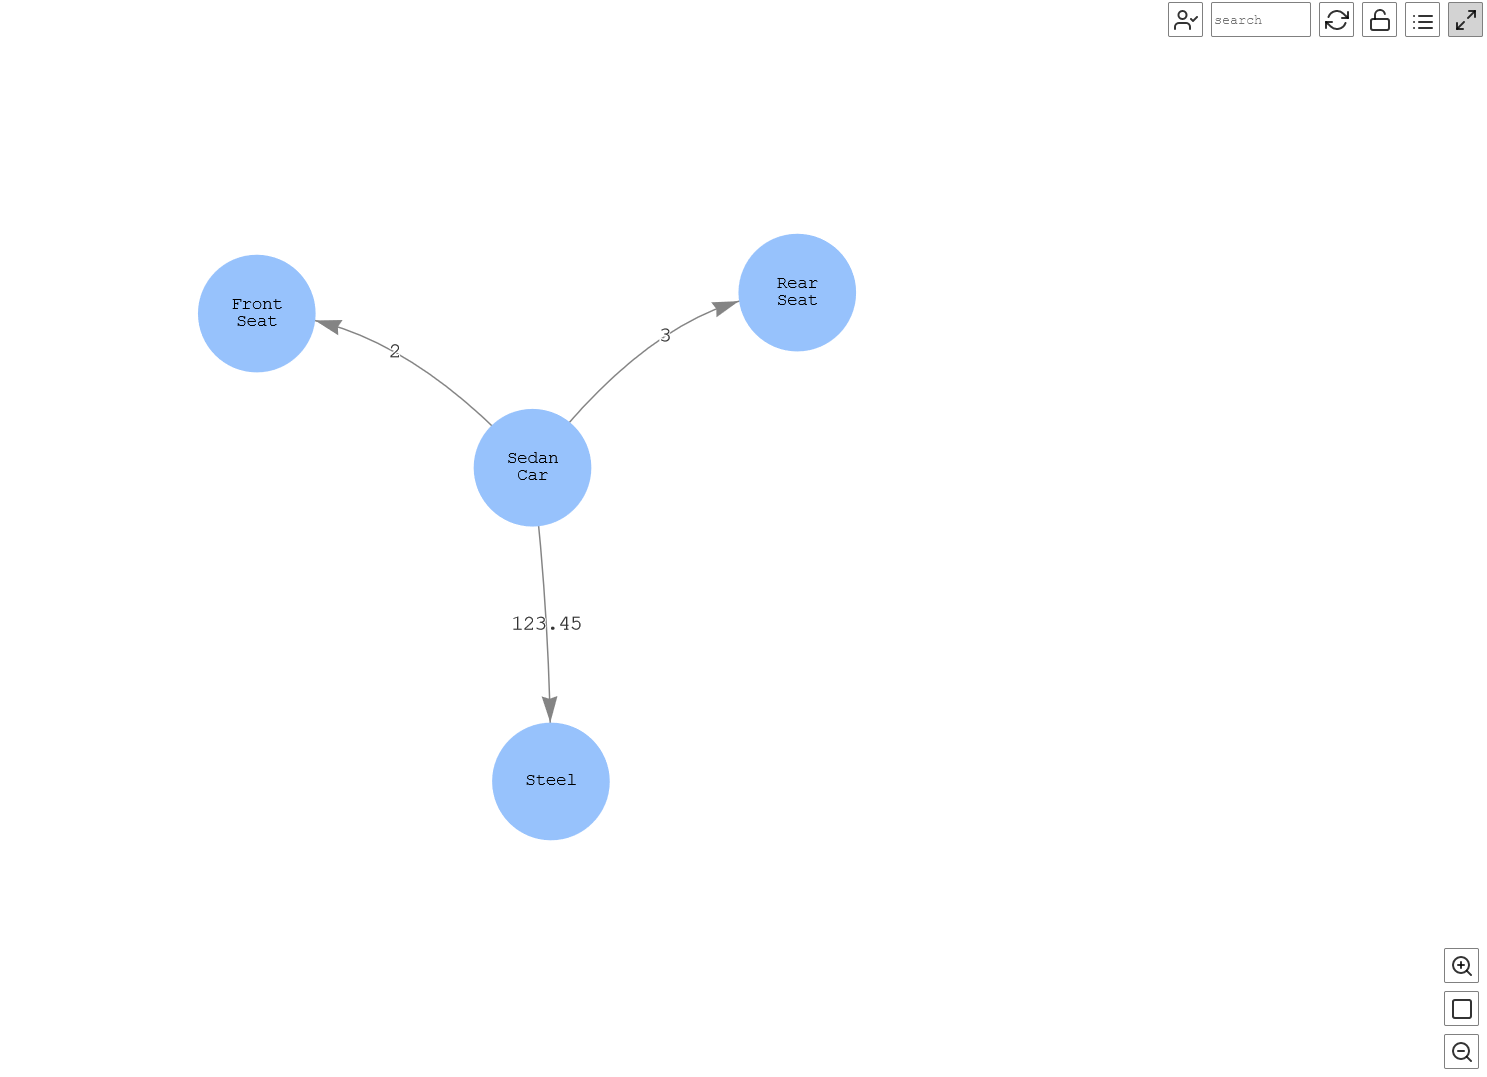
图 12:物料清单
找到汽车所用的各种部件
在物料清单分析的这一部分中,我们想知道汽车的前排座椅是由什么制成的,以及这些部件是由什么材料制成的。这意味着我们希望在第 n 个深度上检查特定产品的关联,这对于分析和采取必要的行动很有用。在这种情况下,海王星在此用例中增加了价值,在该用例中,可以查询第 n 级信息并分析可能影响生产的短缺情况。
在以下查询中,我们查询汽车以获取详细信息;例如,后排座椅由弹簧和加热组件制成。该图还显示弹簧由钢制成,通过这种方式,您可以查询到复杂关系的第 n 级细节。在此示例中,在查询中添加 了 t
imes (2)
,它基本上重复查询两次,给出了第二层细节。请注意,我们可以将此数字更改为任意值以获得所需的详细信息级别。因此,通过此示例,您可以确定客户的第 n 级供应商。
%%gremlin -p v,oute,inv,oute,inv,oute,inv

// get the entire N tier supply

g.V().
  has('name', 'Sedan Car').as('product').
  outE('made_of').
  inV().as('material').
  optional(repeat(outE('made_of').inV().as('material')).times(2).emit()).
  path().by('name').by('qty')
让我们可视化查询输出。
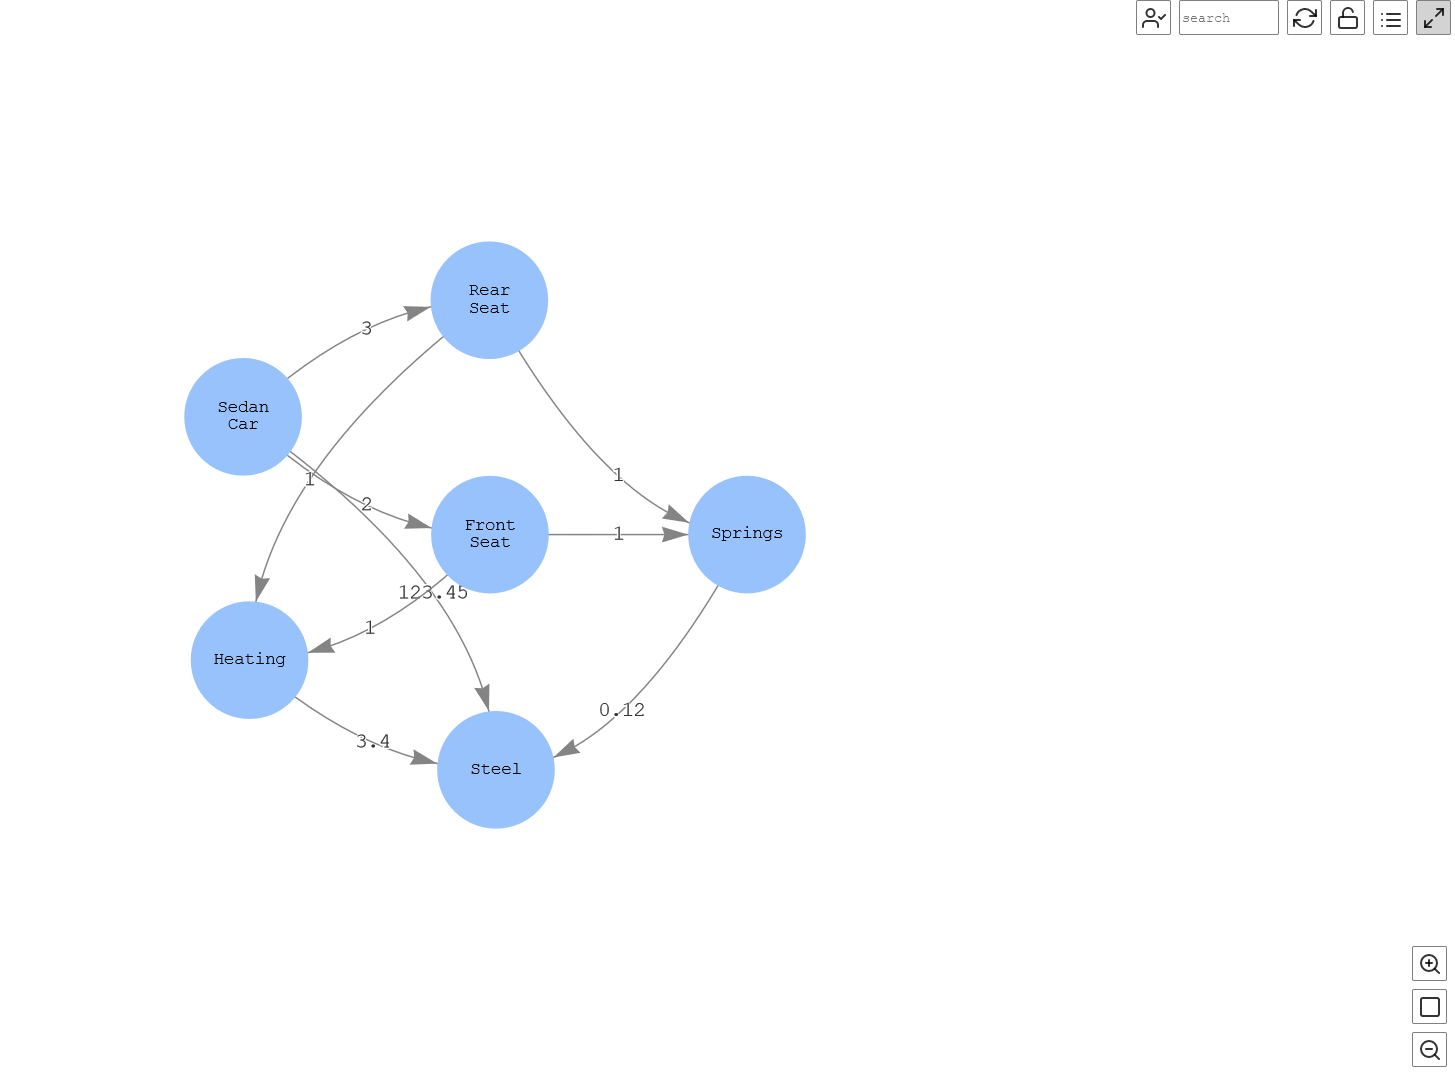
图 13:汽车的各种部件
该图显示,
轿车
由
前排座椅 和 后排座
椅制成 ,后排座椅
带有
加热
组件 ,两者均由
钢
制成 (第二层细节)。
在所有仓库中找到特定车型的库存
现在,让我们查询图表以了解该公司及其子公司在所有S
edan Car
仓库中的库存, 以便应对对生产的任何可能影响。
在以下查询中,我们可以想象到,截至2022年8月1日,所有仓库共有10辆轿车:
%%gremlin -p v,ine,outv

// get company's stock for a date
g.V().has('name', 'Sedan Car').as('product')
    .inE('has_product_in_stock').has('date', datetime('2022-08-01')).outV().as('stock')
    .path().by('name').by('qty').by('date')
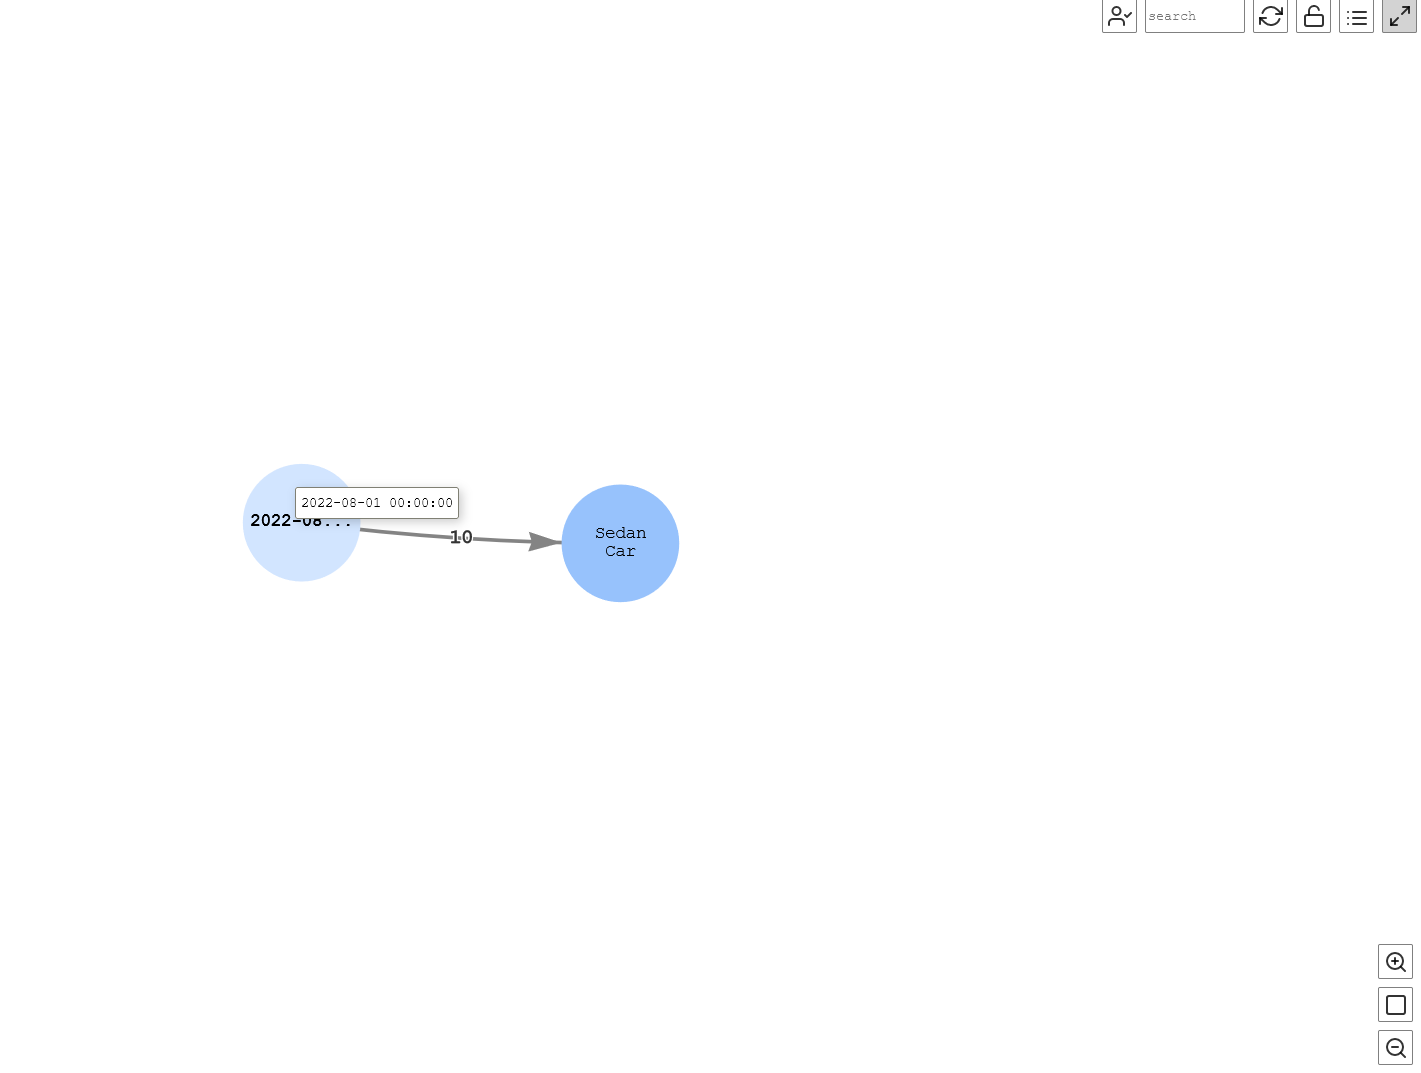
图 14:某一日期的库存
作为一家汽车组织,我们想知道子公司拥有的所有股票。为此,以下查询遍历T
estco-1
的图表, 以获取截至2022年8月1日的股票详细信息,包括子公司:
%%gremlin -p v,oute,inv,oute,inv,oute,inv,oute,inv,oute,inv

// get the stock from all the subsidiaries for a given date
g.V().
  has('name', 'TestCo-1').
  outE('owns').
  inV().as('subsidiary').
  optional(
    outE('has_location').
    inV().as('location').
    outE('has_warehouse').
    inV().as('warehouse').
    optional(
      outE('has_stock').
      has('date', datetime('2022-08-01')).
      inV().as('stock').
      outE('has_product_in_stock').
      inV().as('product'))).
  path().by(elementMap())
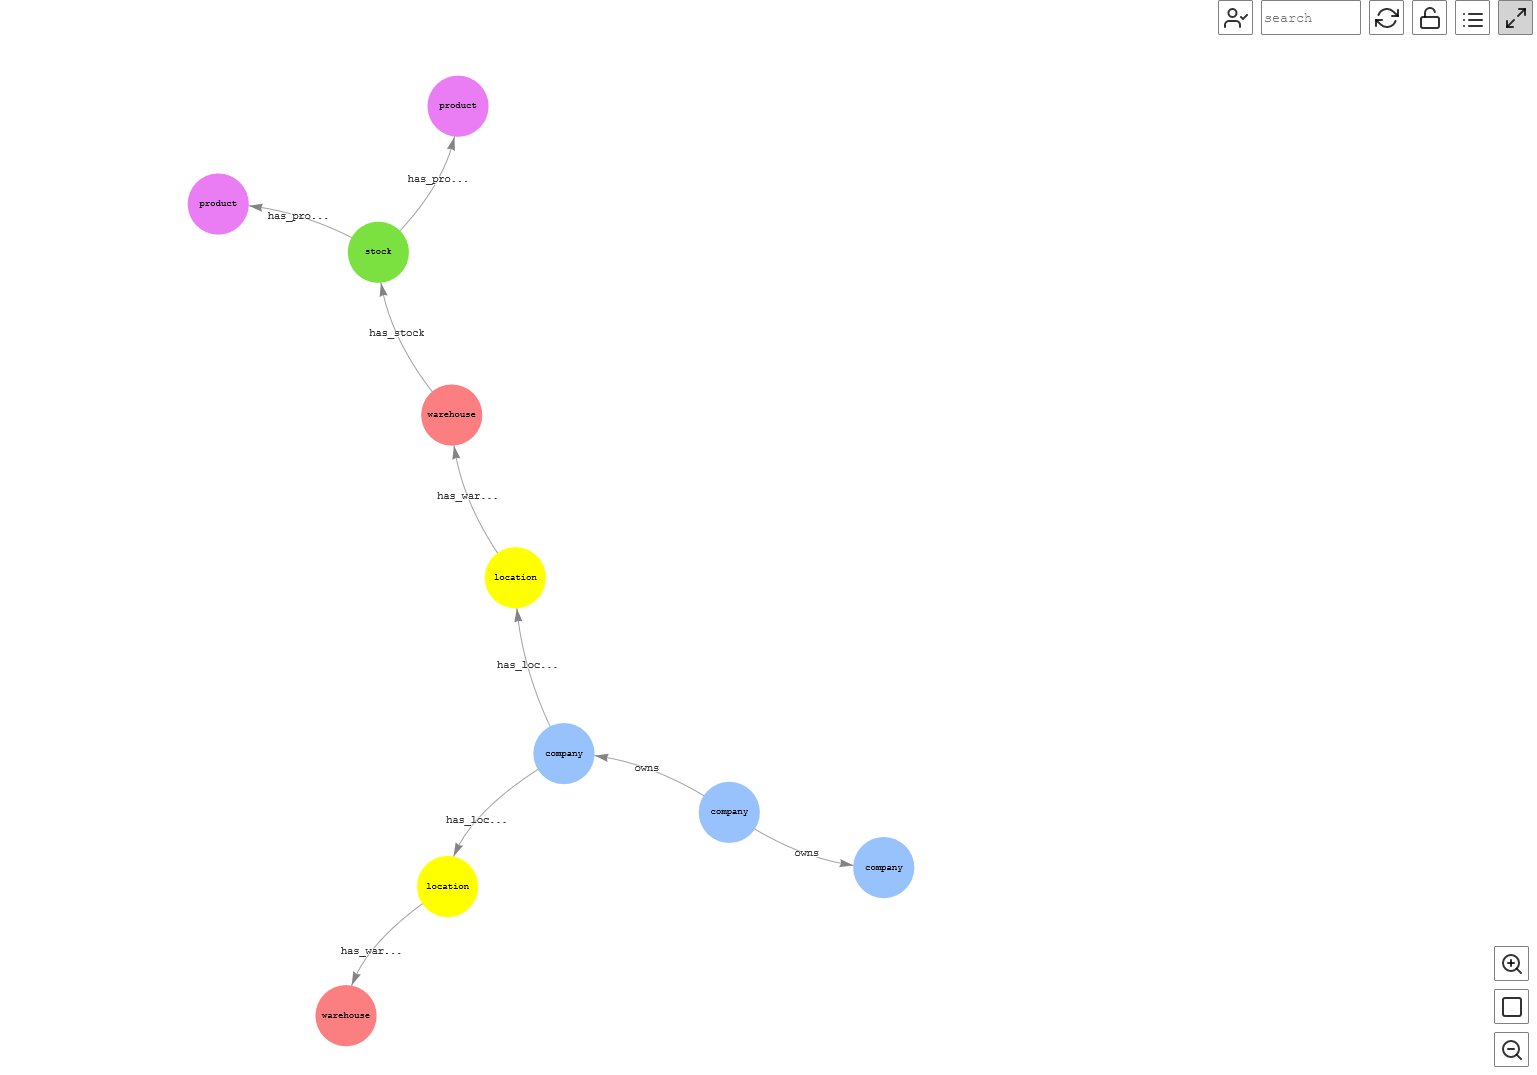
图 15:公司和子公司的股票
          此可视化详细说明了作为

           Testco-

            1 (由Testco-1

           拥有)的子公司TestCo-2

          拥有Facilit

           y-1

          (构成

           仓库-1) ,2022年8月1

          日 ,它拥有轿车和敞篷车的股票。
另一个关键用例可能是了解某一特定日期某一产品及其相应组件在供应链中的所有库存。这为采取任何纠正措施提供了关键信息,从而可以避免库存短缺。请参阅以下查询:
%%gremlin

// get all the stock in the supply chain for a product and its components

g.V().
  has('name', 'Sedan Car').as('product').
  inE('has_product_in_stock').
  has('date', datetime('2022-08-01')).
  outV().as('stock').
  select('product').
  outE('made_of').
  inV().as('material').
  optional(
    repeat(
      outE('made_of').
      inV().as('material').
      optional(
        inE('has_product_in_stock').
        has('date', datetime('2022-08-01')).
        outV().as('stock').
        select('material'))).
      emit()).
  path()
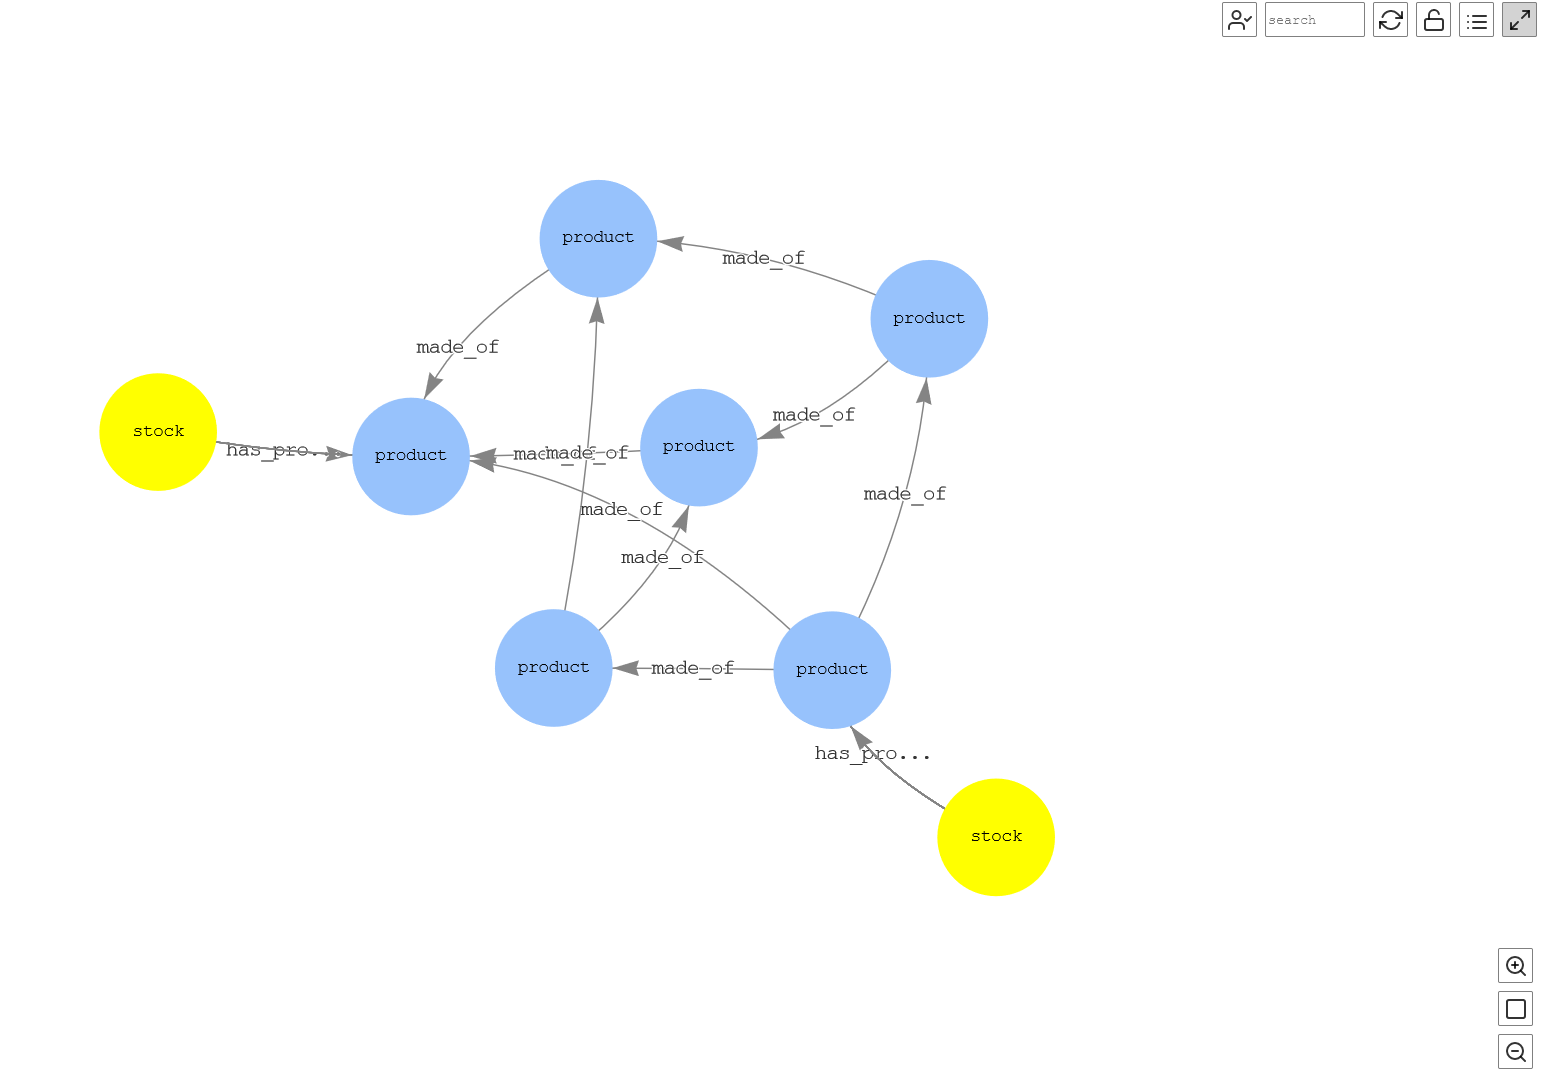
图 16:某一产品在某一日期的库存
最后一个用例是分析供应链中潜在的短缺,这是一个非常重要的部分。以下查询遍历图表,找出给定产品中是否存在任何可能影响该特定产品生产的短缺组件:
%%gremlin

// get potential shortages of components

g.V().
  has('name', 'Sedan Car').as('product').
  repeat(
    out('made_of').as('material').
    inE('has_product_in_stock').
    has('qty', lt(1)).as('stocklevel').
    outV().
    simplePath()).
    emit().
  select('material', 'stocklevel').by(elementMap('date', 'name', 'qty')).
  unfold()
该查询返回的数据显示,2022年8月2日,某个仓库可能出现钢材短缺。

图 17a:可能出现短缺的产品

图 17b:潜在的日期短缺
清理
为了避免将来产生费用,请通过
删除您为这篇文章创建的 CloudFormation
堆栈来删除资源。
结论
在这篇文章中,我们展示了如何使用 Gremlin 查询语言通过海王星图形数据库分析和可视化供应链数据。如今,创新型供应链公司希望越来越多地使用图表分析来增强现有的供应链管理系统,快速捕获数兆字节的数据,并获得对其整个运营前所未有的见解。海王星图形数据库可帮助这些公司进行创新,并在需要时采取纠正措施,以使其运营顺利进行。
我们邀请你试试这篇文章,发表你的评论并通过
亚马逊云科技 Graph notebook GitHub 存储库获得更多动手资料
。
作者简介
 Dhiraj Thakur 是亚马逊网络
服务的解决方案架构师。他与 亚马逊云科技 客户和合作伙伴合作,提供有关企业云采用、迁移和战略的指导。他对技术充满热情,喜欢在分析和人工智能/机器学习领域进行构建和试验。
 Rajdip Chaudhuri
是亚马逊网络服务的高级解决方案架构师,专门研究数据和分析。他喜欢就数据和分析要求与 亚马逊云科技 客户和合作伙伴合作。在业余时间,他喜欢足球、看电影。

![]()


 Dhiraj Thakur 是亚马逊网络
服务的解决方案架构师。他与 亚马逊云科技 客户和合作伙伴合作,提供有关企业云采用、迁移和战略的指导。他对技术充满热情,喜欢在分析和人工智能/机器学习领域进行构建和试验。
 Rajdip Chaudhuri
是亚马逊网络服务的高级解决方案架构师,专门研究数据和分析。他喜欢就数据和分析要求与 亚马逊云科技 客户和合作伙伴合作。在业余时间,他喜欢足球、看电影。