我们使用机器学习技术将英文博客翻译为简体中文。您可以点击导航栏中的“中文(简体)”切换到英文版本。
使用新的统一 SYS 视图简化亚马逊 Redshift 监控
在这篇文章中,我们将讨论亚马逊 Redshift 系统监控视图,以及它们如何简化对 Amazon Redshift 工作负载和资源使用情况的监控。
SYS 监控视图概述
系统监控视图是 Amazon Redshift 中的系统视图,可用于监控预置集群和无服务器工作组的查询和工作负载资源使用情况。它们提供以下好处:
- 它们根据功能对齐进行分类,同时考虑查询状态、性能指标和查询类型
-
我们引入了新的性能指标,例如 planning_time、lock_ wait_time 、rem ote_read_io 和 local_read_io,以帮助进行性能故障排除 - 它通过记录用户提交的查询而不是由 Redshift 优化器重写的查询来提高监控视图的可用性
- 它使用更少的视图提供更多的故障排除指标
- 它允许您在预配置的集群或无服务器工作组中使用相同的查询,从而实现统一的 Amazon Redshift 监控
让我们来看看 SYS 监控视图的一些功能以及如何使用它们进行监控。
统一各种查询级监控指标
下表显示如何将来自多个系统表和视图的查询的各种指标和信息统一到一个系统监控视图中。
| STL/SVL/STV | Information element | SYS Monitoring View | View columns |
| STL_QUERY | elapsed time, query label, user ID, transaction, session, label, stopped queries, database name | SYS_QUERY_HISTORY |
user_id query_id 查询标签 交易编号 会话_id 数据库名称 查询类型 状态 result_cache_hit 开始时间 end_time 经过的时间 排队时间 执行时间 错误消息 返回的行 返回的字节 查询文本 redshift_vers 使用量限制 计算类型 编译时间 规划时间 lock_wait_time |
| STL_WLM_QUERY | queue time, runtime | ||
| SVL_QLOG | result cache | ||
| STL_ERROR | error code, error message | ||
| STL_UTILITYTEXT | non-SELECT SQL | ||
| STL_DDLTEXT | DDL statements | ||
| SVL_STATEMENTEXT | all types of SQL statements | ||
| STL_RETURN | return rows and bytes | ||
| STL_USAGE_CONTROL | usage limit | ||
| STV_WLM_QUERY_STATE | current state of WLM | ||
| STV_RECENTS | recent and in-flight queries | ||
| STV_INFLIGHT | in-flight queries | ||
| SVL_COMPILE | compilation |
有关 SYS 到 STL/SVL/STV 映射的更多信息,请参阅
用户查询级日志
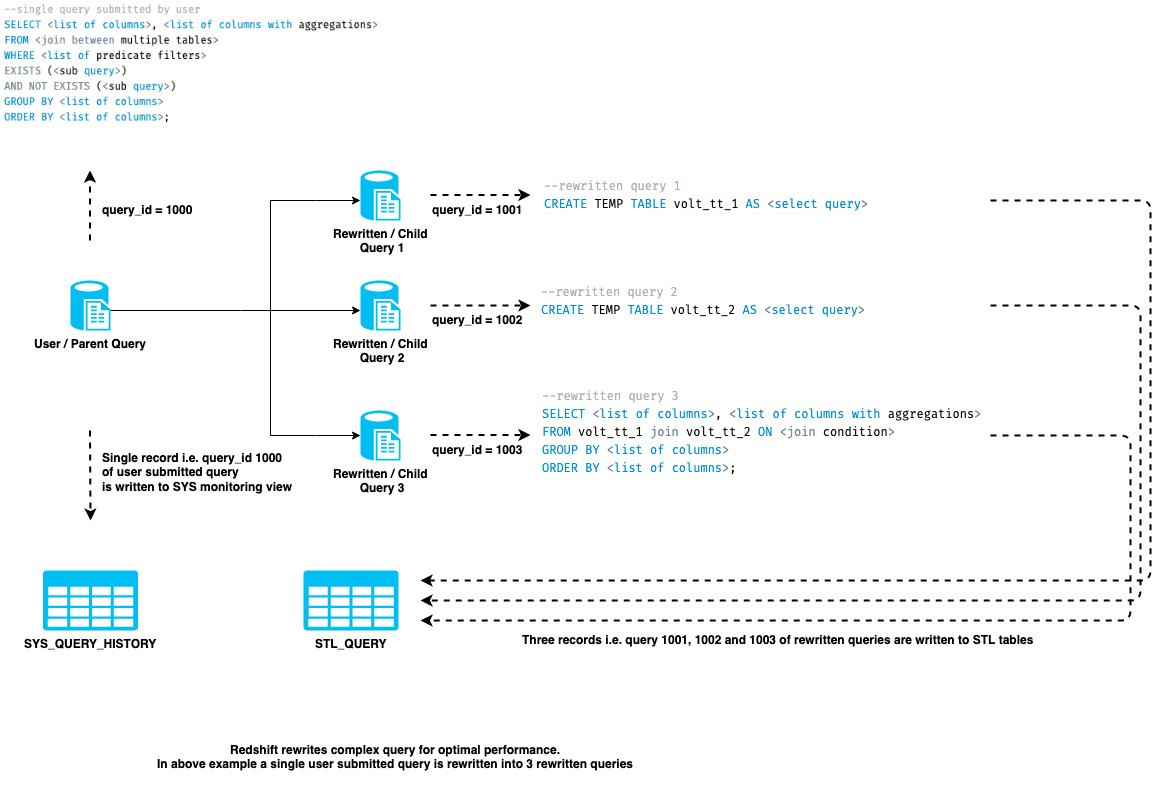
为了提高查询性能,Redshift 查询引擎可以重写用户提交的查询。用户提交的查询标识符与重写的查询标识符不同。在这篇文章中,我们将用户提交的 查询称为 父查询 ,将重写的 查询称为 子查询 。
下图说明了父查询级别和子查询级别的日志记录。父查询标识符为 1000,子查询标识符为 1001、1002 和 1003。
查询生命周期时机
| Time metrics | Description |
| planning_time | The time the query spent prior to running the query, which typically includes query lifecycle phases like parse, analyze, planning and rewriting. |
| lock_wait_time | The time the query spent on acquiring the locks on the required database objects referenced. |
| queue_time | The time the query spent in the queue waiting for resources to be available to run. |
| compile_time | The time the query spent compiling. |
| execution_time | The time the query spent running. In the case of a SELECT query, this also includes the return time. |
| elapsed_time | The end-to-end time of the query run. |
解决方案概述
我们讨论以下场景以帮助熟悉 SYS 监控视图:
- 工作负载和查询生命周期监控
- 数据摄取监控
- 外部查询监控
- 查询性能缓慢疑难解答
先决条件
您应该具备以下先决条件以及本文中的示例:
-
一个
亚马逊云科技 账户 -
Redshift 预置的集群(当前曲目)或
Amazon Red shift 无服务器端点
此外,
工作负载和查询生命周期监控
在本节中,我们将讨论如何监控工作负载和查询生命周期。
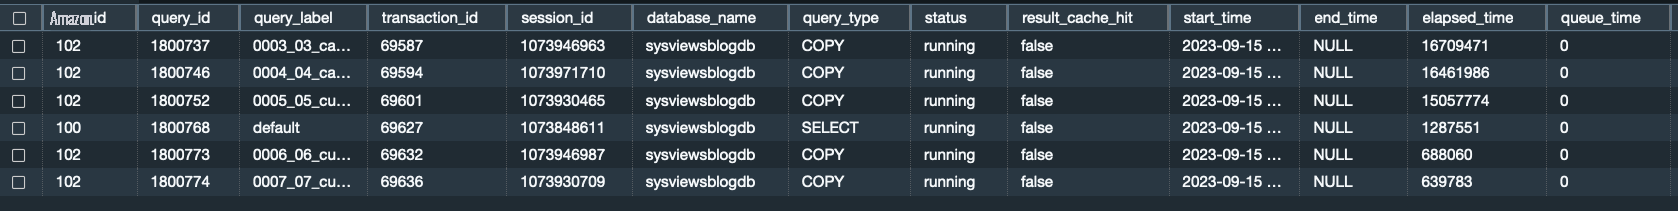
识别机上查询
我们得到以下输出。
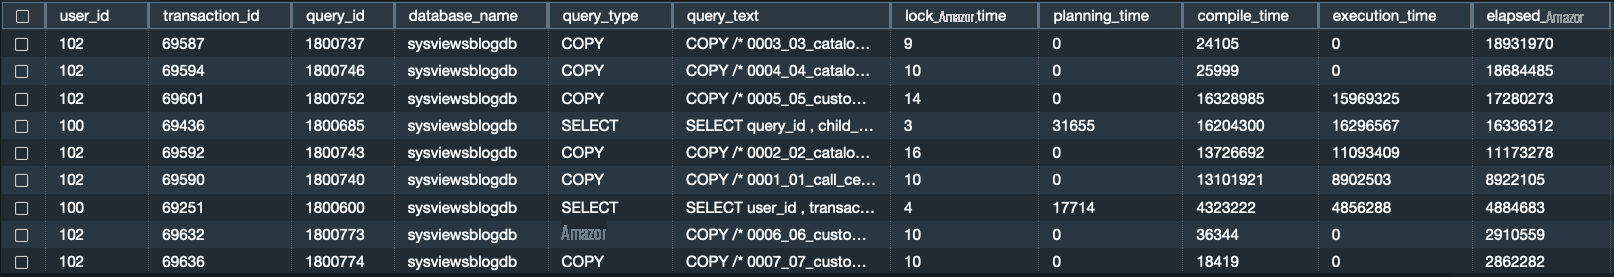
识别最长时间运行的查询
以下查询有助于检索运行时间最长的前 100 个查询。分析(如果可行,还可以优化)这些查询可以帮助提高整体性能。这些指标是所有查询运行的累积统计信息。请注意,所有时间值均以微秒为单位。
我们得到以下输出。
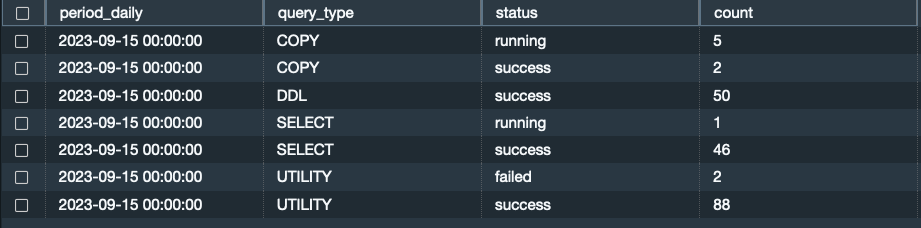
按查询类型、时间段和状态收集每日查询数
以下查询可深入了解不同类型的查询在不同日期内的分布情况,并有助于评估和跟踪工作负载的任何变化:
我们得到以下输出。
收集飞行中查询的运行详情
is_active = 't'
过滤器。
要查看最新运行的 100 个 COPY 查询,请使用以下代码:
我们得到以下输出。
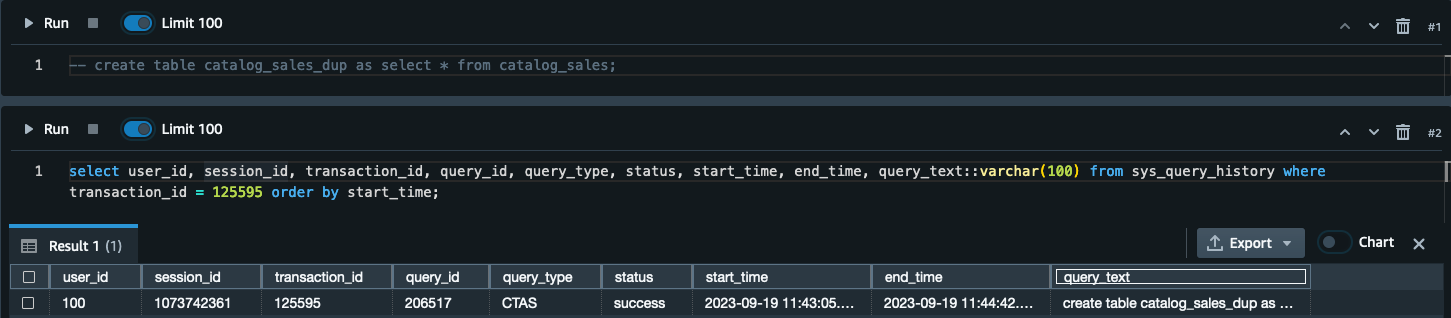
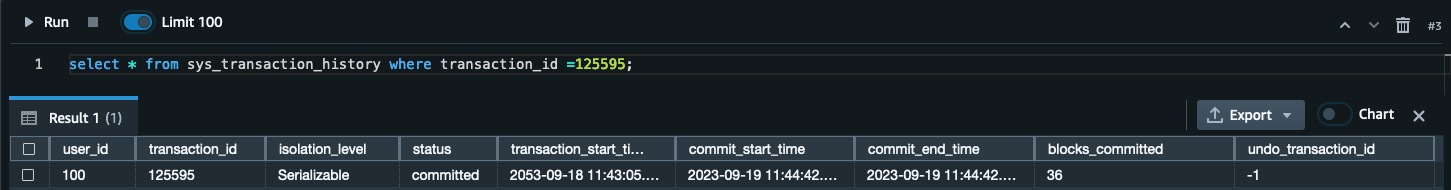
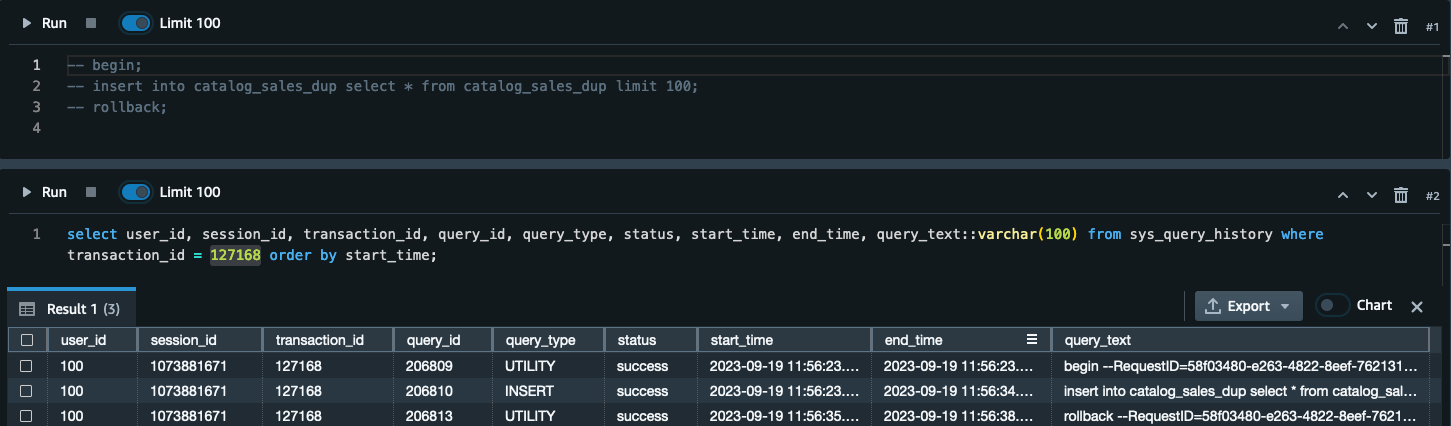
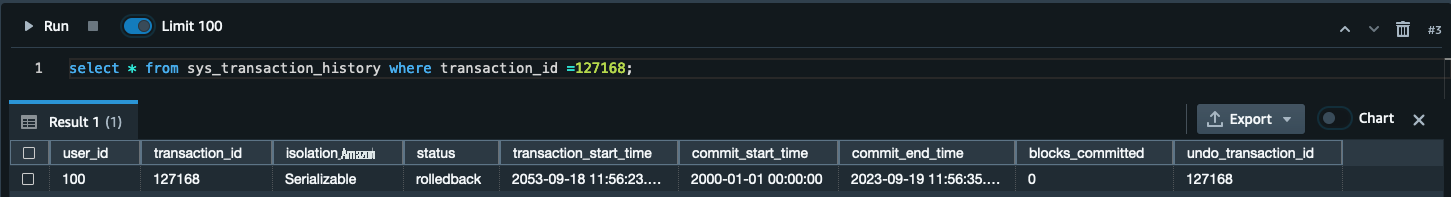
收集交易级别的详细信息以供提交和撤消
以下屏幕截图说明如何获取有关成功提交的交易的详细信息。
以下屏幕截图说明如何获取有关已回滚交易的详细信息。
统计数据和真空
我们得到以下输出。

我们得到以下输出。

数据摄取监控
在本节中,我们将讨论如何监控数据摄取。
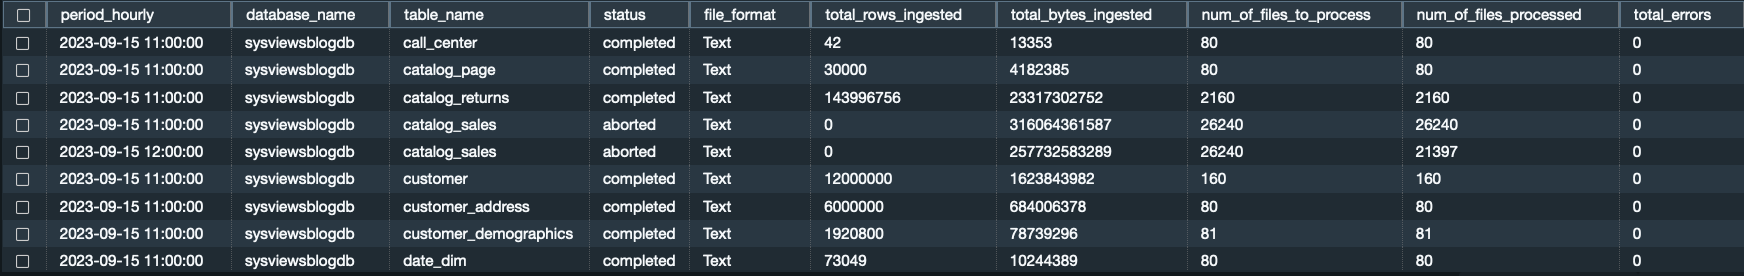
摄取摘要
我们得到以下输出。
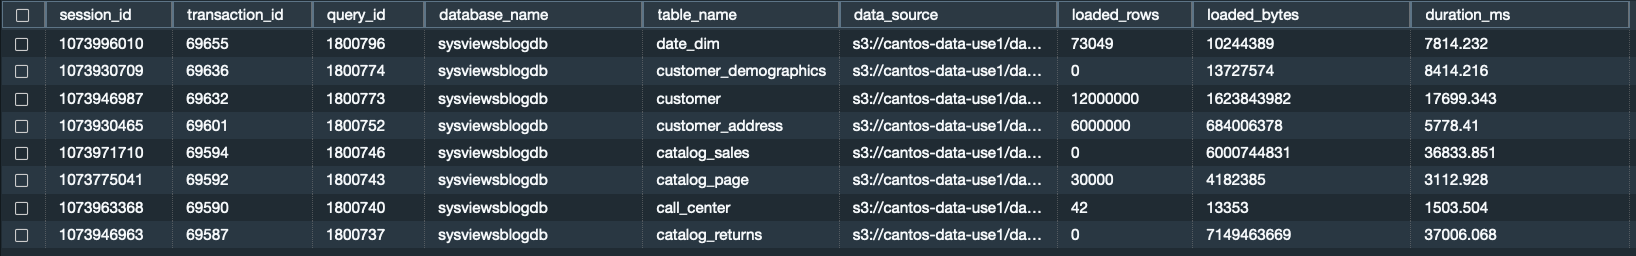
文件级入口日志
sys_load_
history 查看以下查询:
我们得到以下输出。

以下示例显示了详细的文件级监控是什么样子:
在入口过程中检查是否有错误
我们得到以下输出。

外部查询监控
-
扫描的外部文件数量(
scanned_files)和外部文件的格式(文件格式),例如 Parquet、文本文件等 -
按行(返回的行 )和字节(返回的字节)扫描的数据 -
外部查询和表对分区(
总分 区和限定分区)的使用 -
详细了解给定外部对象的列表 (
s3list_time ) 和限定分区 (get_partition_time) 所花费的时间 -
外部文件位置(文件位置)和外部表名( 表名) -
外部来源的类型(
source_type),例如适用于 Redshift Spectrum 的亚马逊简单存储服务 (Amazon S3)或联合来源 -
递归扫描子目录 (is_recursive ) 或访问嵌套列数据类型 (is_nested)
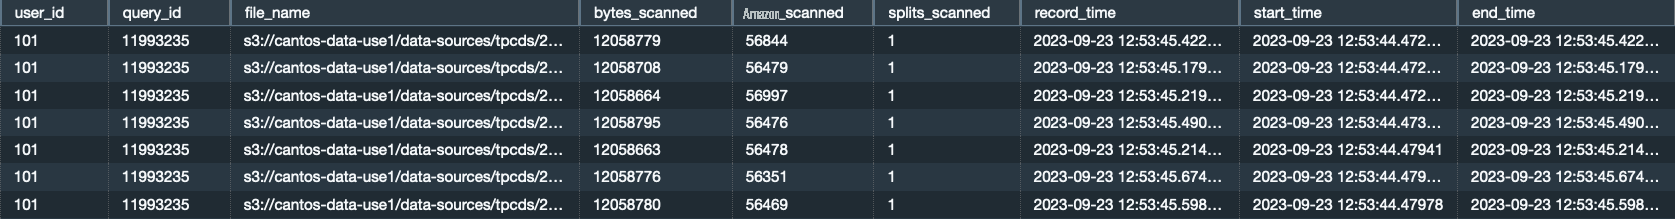
例如,以下查询显示了运行的外部查询和扫描的数据数量的每日摘要:
我们得到以下输出。

分区的使用
您可以验证扫描大量数据和文件的外部查询是否已分区。使用分区时,可以通过根据分区键进行修剪来限制外部查询必须扫描的数据量。参见以下代码:
我们得到以下输出。

          对于外部查询中遇到的任何错误,请查看

           SYS_EXTERNAL_QUERY_ERROR

          ,它按

           文件

          位置、列和行号的粒度记录详细信息。
查询性能缓慢疑难解答
有关如何使用
SYS 监控视图执行查询级故障排除的分步指南,请参阅作为先决条件一部分下载的 sysview_slow
_query_performance_formance_dishoublace SQL 笔记本,并查找以下问题的答案:
- 被比较的查询是否有相似的查询文本?
- 查询是否使用了结果缓存?
- 查询生命周期的哪些部分(排队、编译、规划、锁定等待)对查询运行时的贡献最大?
- 查询计划有变化吗?
- 查询是否正在读取更多数据块?
- 查询是否已溢出到磁盘?如果是,它会溢出到本地还是远程存储?
- 查询在数据(分布)和时间(运行时间)方面是否存在严重偏差?
- 您是否看到在联接步骤或嵌套循环中处理了更多行?
- 是否有任何警报表明统计数据已过时?
- 上次对查询中涉及的表进行抽真和分析是什么时候?
清理
如果您在本文中创建了任何 Redshift 预置集群或 Redshift Serverless 工作组,并且不再需要它们来处理您的工作负载,则可以将其删除以避免产生额外费用。
结论
在这篇文章中,我们解释了如何使用 Redshift SYS 监控视图来监控预置集群和无服务器工作组的工作负载。SYS 监控视图简化了对工作负载的监控,可以从统一视图访问各种查询级别的监控指标,并能够使用相同的 SYS 监控视图查询在预置集群和无服务器工作组上运行。我们还使用系统监控视图介绍了一些关键的监控和故障排除方案。
我们鼓励您开始使用新的 SYS 监控视图来处理 Redshift 工作负载。如果您有任何反馈或问题,请在评论中留言。
作者简介


*前述特定亚马逊云科技生成式人工智能相关的服务仅在亚马逊云科技海外区域可用,亚马逊云科技中国仅为帮助您发展海外业务和/或了解行业前沿技术选择推荐该服务。