我们使用机器学习技术将英文博客翻译为简体中文。您可以点击导航栏中的“中文(简体)”切换到英文版本。
使用竞价放置分数优化 Amazon EC2 竞价型
这篇博客文章由南澳首席专家史蒂夫·科尔和高级专家罗伯特·麦康撰写。
只需配置即可获得所需的计算资源,甚至数以百万计的 vCPU,并使用
关于竞价排名分数
竞价放置分数是通过 亚马逊云科技 API 提供的一项功能(也在 Amazon EC2 竞价请求控制台中实现),它使用内部容量和中断数据来仔细检查竞价型实例请求的大小和形状,并以 “成功可能性” 评级为 1 表示成功的可能性较低,10 表示成功的可能性更高。该分数表示对能够在接下来的几个小时内使用实例配置(形状)获得所需容量(大小)的信心。请求的形状可以是特定实例的列表,也可以基于需求选择基于
在发布竞价投放分数之前,客户可以跟踪其现有工作负载和配置的趋势。这可能有助于他们预测一段时间内的容量限制,但是在评估配置时能够做一些更有意义的事情是客户经常要求的。随着竞价放置分数的推出,该功能得以提供,使客户能够获得有关配置更改可能如何影响工作负载中竞价型实例效率的指导。
客户立即意识到了这项新功能的力量,并开始围绕其工作负载编写工具,以整合竞价投放分数提供的新功能。例如,客户利用竞价投放分数在集群内需要低延迟的工作区域中找到得分最高的可用区。使用
竞价投放分数的好处
一位特定客户使用竞价
其他客户使用存储在时间序列数据库中的常规查询来跟踪一段时间内的竞价放置分数,以确定运行工作负载的最佳配置或位置,还能确定一天中或一周中运行工作负载的最佳时间。通过自动化查询了实例类型的不同配置,并将结果记录到时间序列数据库中,然后可以以图表形式呈现。仔细检查了这些图表,调整了配置,最终,这些客户可以在分数较高的地方和时间运行工作负载,从而减少中断,从而更好地利用竞价型实例提供的成本优化。
亚马逊云科技对这如何为客户解决问题很感兴趣,在对客户进行了更多研究和设计构想之后,亚马逊云科技最近发布了一款OSS工具:竞价排名分数追踪器。点位分数追踪器可帮助客户根据多个时间和地点评估不同的配置。这是一个 亚马逊云科技 原生解决方案,它利用竞价投放分数 API 以及 亚马逊云科技 Lam
如何使用竞价排名分数追踪器
该项目使用
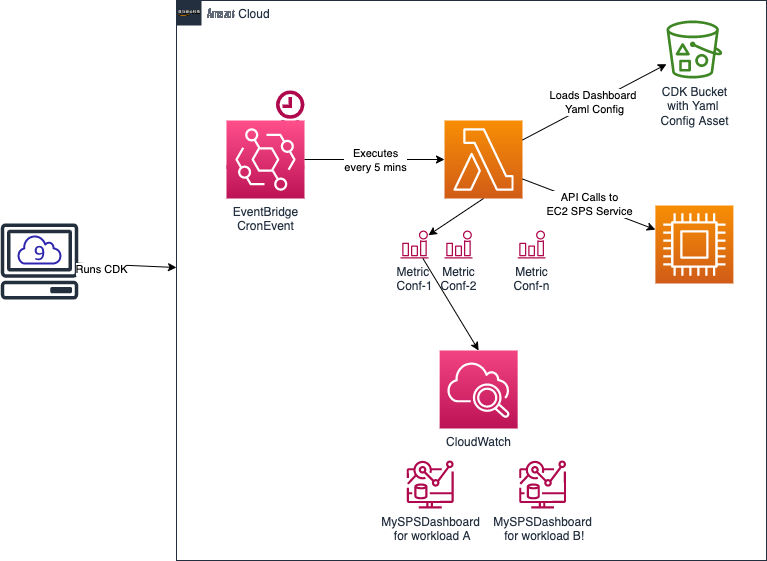
安装 CloudWatch 控制面板并留出一些时间来收集和记录数据后,您将通过直观的图表获得宝贵的见解,例如以下示例中的见解。
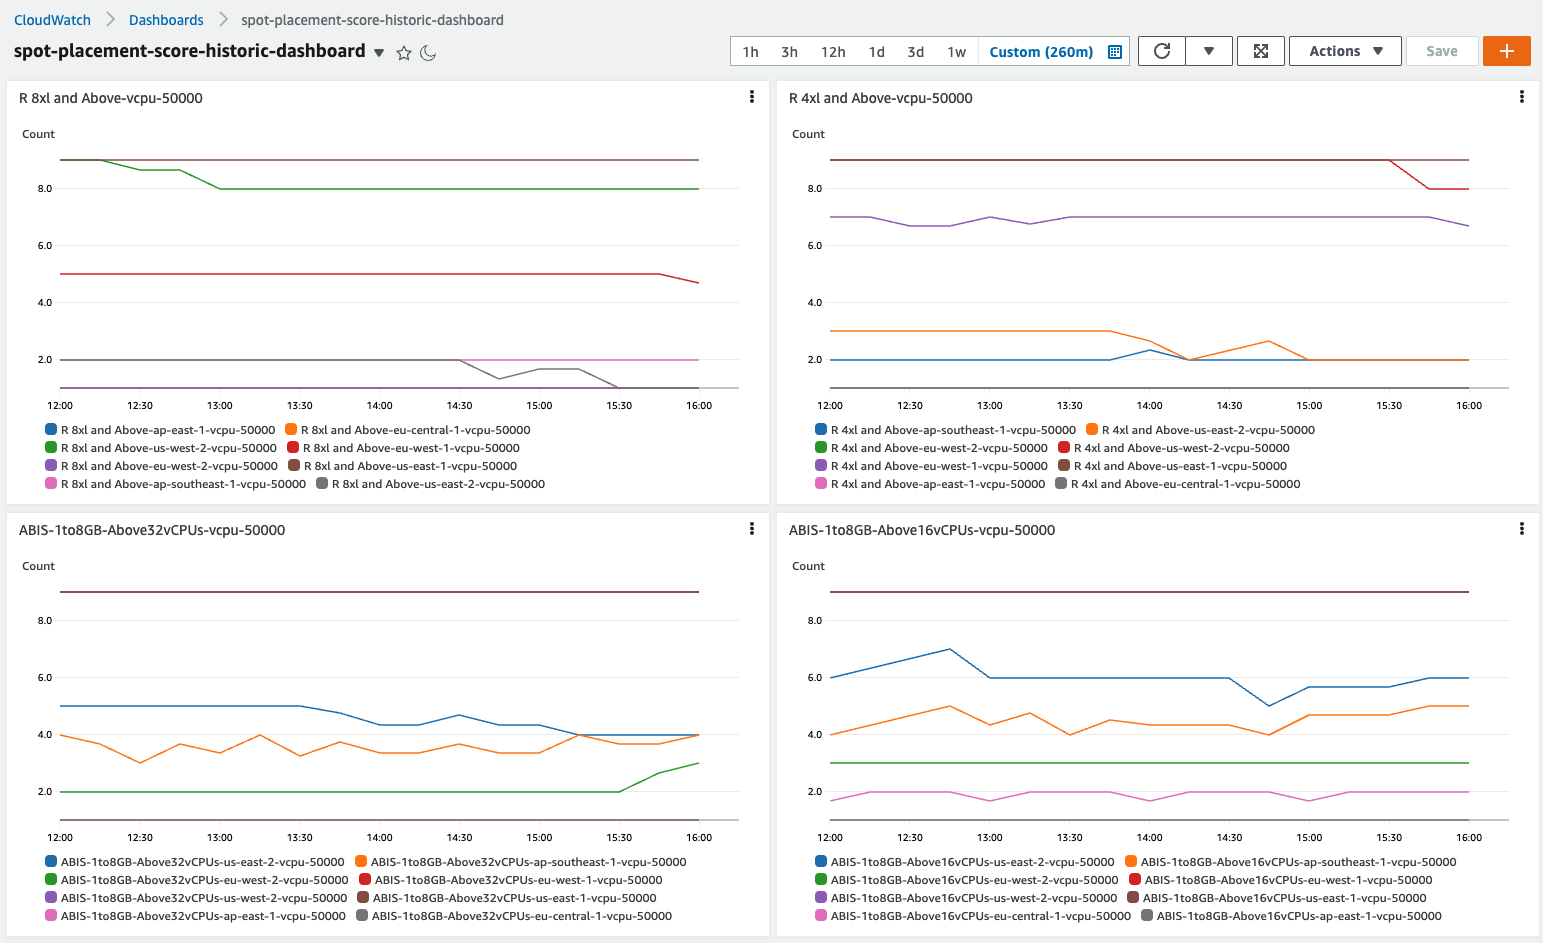
通过 Spot 排名分数追踪器获得见解
通过观察一段时间内的数据,你可能会注意到的第一件事是,实例多样化是高排名分数的主要驱动力。这一直是使用竞价型实例的最佳实践,它也扩展到按需实例。简而言之,如果您只能在一种实例类型上运行,那么遇到中断的可能性远大于在六或十二个实例类型上运行的可能性。
通过使用一段时间内的排名分数,您可以获得的第二个见解是确定可以放置短暂过程的最佳可用区。也许这种洞察力的最佳用例是启动数据分析集群,这些集群旨在在一夜之间完成许多计算。这在金融机构中很常见,原因有很多,包括风险分析和合规,但可能适用于检查白天实验结果的医学研究以及工作量不要求全天候在场的其他情况。这些客户通常使用单个可用区来加快节点之间的通信并降低数据传输成本。因此,竞价放置分数能够为不同的可用区提供不同的分数是非常有利的。
第三,通过获得一段时间内的安置分数,可以准确地确定工作负载的占用量。通过向 Spot 放置分数提交相同但大小不同的配置,您可以显示理想的工作负载规模。不太小,任务可能需要很长时间才能完成,但也不会太大,以至于中断过于频繁并导致重启。这不仅可以使临时工作负载受益,还可以使持久集群或队列受益,因为他们可以了解一段时间内的最低分数是多少,并为您提供有关竞价型实例可以预期得到什么以及在何处的可靠信息。这可能会提醒您做好启动按需实例的准备,以便在竞价型实例可用性降低时进行补偿。这还有助于预测定价并为考虑使用 亚马逊云科技
最后,分析一段时间内的竞价投放分数可以提供区域评分。通过这个视角,您可以识别出他们可能忽略的整个区域,而无需知道主区域以外的竞价型实例由于处于非高峰时段,在白天可能会减少中断次数。如果可以将工作负载放在另一个区域,不受本地数据访问要求的限制,则很有可能在原本未得到充分利用的地点利用大量占用空间的计算。需要较少的数据传输和更多计算的工作负载可以从访问其他地区的竞价型实例中受益匪浅。例如,在北美工作时间,诸如构建服务器之类的东西可能在欧洲运行得非常好,计算成本的降低可能会抵消为完成工作而传输的数据。
结论
竞价放置分数可用于决定如何、何时和在何处可以最有效地利用竞价型实例来满足业务需求,而且价格会大大降低。我们很高兴发布此工具,使您能够利用以前不可用的信息,为您的业务做出以数据为导向的决策。这篇文章中的信息,加上一段时间内的排名分数输出,是一个重大变化。
立即安装竞价投放分数追踪器,对其进行配置以匹配现有的竞价工作负载,并查看您在不同时间或不同地点的表现如何。探索更强大的选项,发现更大的容量和更少的中断。或者研究按需工作负载如何迁移到竞价型实例。
*前述特定亚马逊云科技生成式人工智能相关的服务仅在亚马逊云科技海外区域可用,亚马逊云科技中国仅为帮助您发展海外业务和/或了解行业前沿技术选择推荐该服务。