Detecting gray failures with outlier detection in Amazon CloudWatch Contributor Insights

by Raghu Iyer and Michael Haken | on

You may have encountered a situation in the past where a single user or small subset of users of your system are reporting an event that is impacting their experience, but your observability systems didn’t show any clear impact. The discrepancy between the customer’s experience and the system’s observation of its health is referred to as differential observability. In other words, different perspectives observe failures differently, and these are gray failures. Gray failures are normal failures that are undetected by the system where they’re occurring, even though the customer experience is impacted. Gray failures can originate from both your workload as well as the dependencies it relies upon.

Accurately responding to and mitigating gray failures in a timely manner requires turning them into detected failures. This post will help you build an observability strategy to turn gray failures into detected failures using outlier detection. Outlier detection is a process of detecting data points that are far away from the mean or median values in a system.

Amazon CloudWatch Contributor Insights is a service that will help detect outliers in your workloads. You can use Contributor Insights to analyze log data and create time series representations to display contributor data. You can use this technique to find hosts and Availability Zones (AZ) that are experiencing a much higher error rate than others, indicating they may be experiencing a gray failure.

In this blog post, you will learn how to use CloudWatch Contributor Insights to perform outlier detection. This approach will help you locate the source of gray failures that might otherwise go undetected using only standard availability or latency metrics. By comparing errors rates or latency across hosts and AZs, you’ll be able to turn gray failures into detected failures that you can respond to.

Why gray failures manifest as outliers
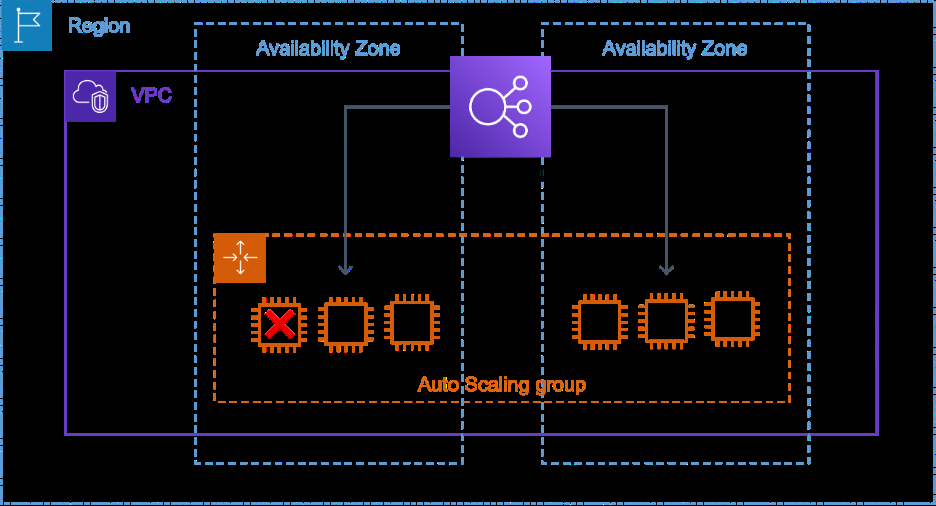
Imagine an Amazon Elastic Compute Cloud (Amazon EC2) server fleet with 50 instances spread across multiple AZs in an Auto Scaling group behind an Amazon Elastic Load Balancer (ELB) shown in the following figure. One of the instances experiences a degradation in its Amazon Elastic Block Store (EBS) volume which makes it unable to successfully process customer requests. This impairment doesn’t impact its ability to respond to the load balancer’s health checks and it appears healthy to the load balancer as well as to the EC2 status checks . The instance impairment causes a 2% error rate across the fleet, resulting in an overall 98% availability. In this example, customers are being impacted, but there’s no alarm to alert operators that a single instance is the source of this availability drop and therefore no automated actions are taken to mitigate the problem.

Figure 1 – EC2 instances in an auto scaling group behind a load balancer with one instance that is observed to be healthy, but fails to process customer requests

The per server error rate metrics would show a significant difference between the EC2 instance with the impaired EBS volume and all of the rest of the fleet. However, in a deployment of 10s or 100s of instances, it’s not typical or practical to create an availability or latency alarm per instance, especially when they are treated as ephemeral resources, constantly being provisioned or terminated. Per server alarms can also be cost prohibitive and they won’t notify you that one instance has a significantly higher error rate than the others, which is what we want to know. Outlier detection helps operators distinguish between impact being caused by a single resource versus multiple resources. It also removes the dampening effect that many healthy resources can have on fault and latency metrics produced by a single unhealthy host.

Finding single-host gray failures
We will use Contributor Insights to find the outlier in the fleet. We start by recording metrics about each unit of work (e.g. an HTTP request, an SQS message, a batch job, etc.) received for processing. The CloudWatch embedded metric format (EMF) is a way to combine metrics and logs that allows you to automatically extract metric data from the logs files you publish to CloudWatch Logs. This approach has significant cost savings versus publishing custom metrics directly with the PutMetricData API . EMF also provides a single pane of glass for logs and metrics.

In our example, the instances are writing structured logs with data elements like InstanceId, Faults, Success, Latency, and more to CloudWatch Logs. You create a Contributor Insights rule in CloudWatch to graph the top contributors to the number of faults from these log files. The following example rule definition will identify the EC2 instances that are contributors to the total number of faults seen in the fleet.

{
	"AggregateOn": "Sum",
	"Contribution": {
		"ValueOf": "$.Faults",
		"Keys": [
		  "$.InstanceId"    
		],
		"Filters": []
	},
	"LogFormat": "JSON",
	"Schema": {
		"Name": "CloudWatchLogRule",
		"Version": 1
	},
	"LogGroupARNs": [
		"arn:aws:logs:us-east-1:123456789012:log-group:front-end-fleet"
	]
}

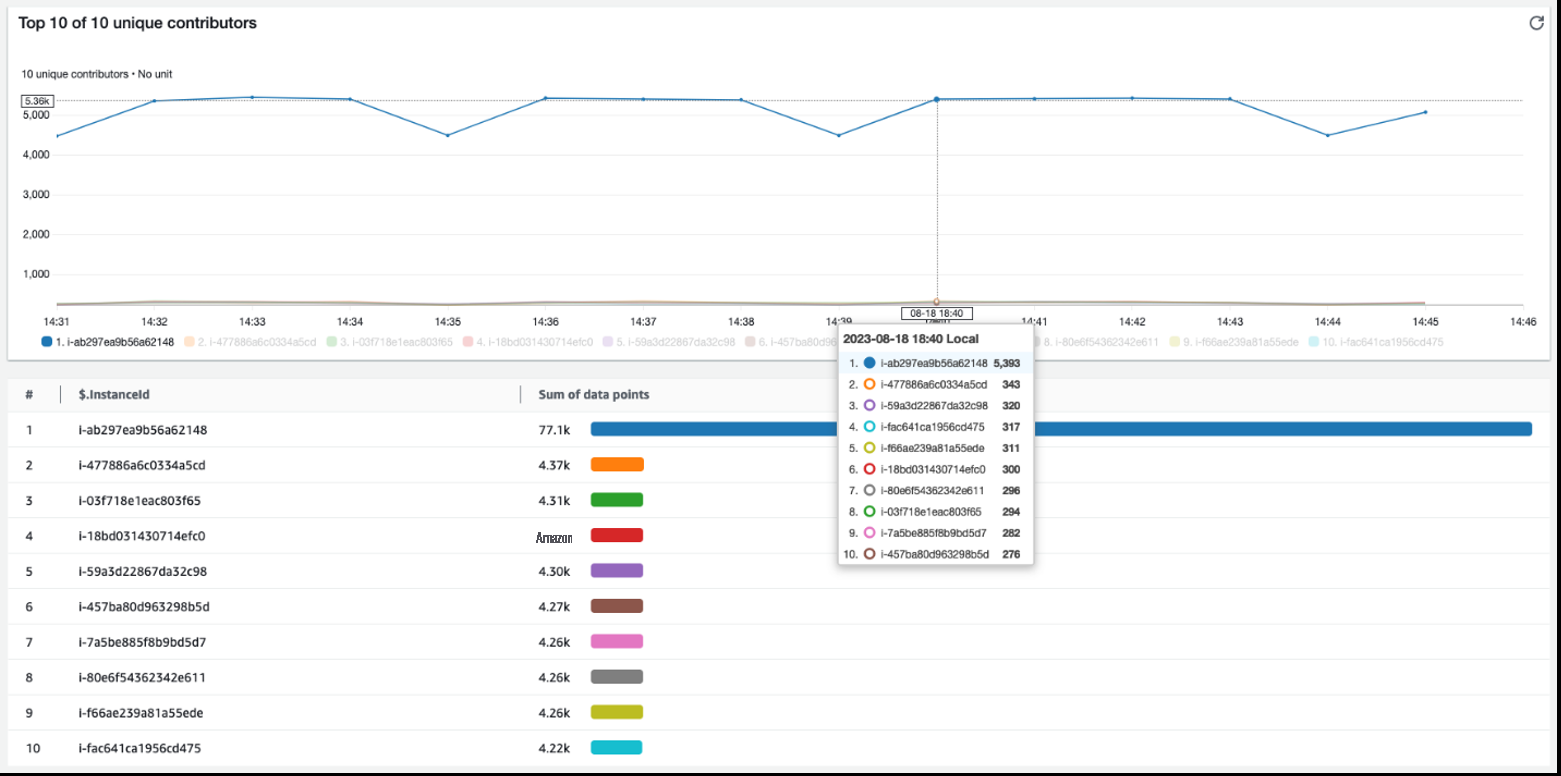
Using this rule, CloudWatch displays a graph similar to the following:

Figure 2 –  Contributor Insights graph of contributors to faults in the front-end fleet

All the instances shown here are producing some quantity of errors, but instance i-ab297ea9b56a62148 stands out as an outlier with nearly 20x the number of errors. The Contributor Insights rule shows the impact of a gray failure clearly and has turned it into a detected failure.

Our goal is to automate the detection of this type of failure and reduce operator intervention. We will use CloudWatch alarm metric math with Contributor Insights rules for this automation. The following alarm definition will alert when a single instance is contributing at least 70% of the total errors. This quantity is representative for this post, it’s not intended to be a prescriptive number, your threshold might be 30% or 50%, which may vary depending on the size of your fleet and use case.

INSIGHT_RULE_METRIC(…, ‘MaxContributorValue’) / INSIGHT_RULE_METRIC(…, ‘Sum’) >= .7

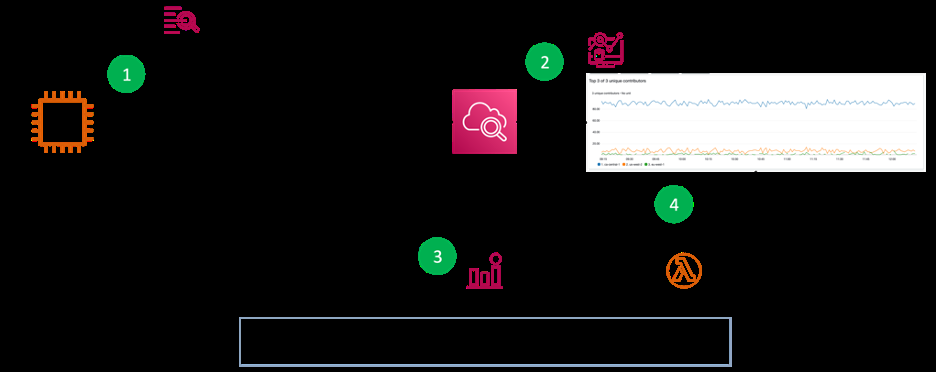
The above alarm definition doesn’t inform us about the specific instance that is the max contributor, only that a contributor crossed the defined threshold. To find the max contributor, you can have this alarm send an SNS notification that triggers a Lambda function. The function can use the GetInsightRuleReport API to find the max contributor and then take an action like terminating it through Auto Scaling, shown in the following figure.

Figure 3 – After publishing EMF logs to CloudWatch that feed a Contributor Insights rule, an alarm invokes a Lambda function that automatically finds the max contributor to faults

If you decide to take an automated action based on this kind of alarm, ensure you implement velocity control to prevent too many instances from being terminated in a short period of time. Instead, you may want to notify a human operator to get them involved. Using a static value for the percentage of errors isn’t the only approach you can use; you could use a chi-squared test (see an example here and here ), k-means clustering , or z-score to find outliers as well. Each approach will vary in the complexity of its implementation and have varying levels of accuracy , precision , specificity, and sensitivity .

Finding single-AZ gray failures
The other place where we regularly see gray failures is within a single AZ. In this case, transient networking impairments or impairments affecting a zonal service sometimes manifest as a gray failure. You can use the same outlier detection mechanism that you used for detecting single-instance gray failures to detect single-AZ gray failures.

To do so, you need your instances to include their Availability Zone ID as one of the fields in their log files. Then, you can create a Contributor Insights rule to detect an AZ that is an outlier because of its error rate.

{
      "AggregateOn": "Sum",
      "Contribution": {
            "ValueOf": "$.Faults",
            "Keys": [
              "$.AZ-ID"   
            ],
            "Filters": []
      },
      "LogFormat": "JSON",
      "Schema": {
            "Name": "CloudWatchLogRule",
            "Version": 1
      },
      "LogGroupARNs": [
            "arn:aws:logs:us-east-1:123456789012:log-group:front-end-fleet"
      ]
}

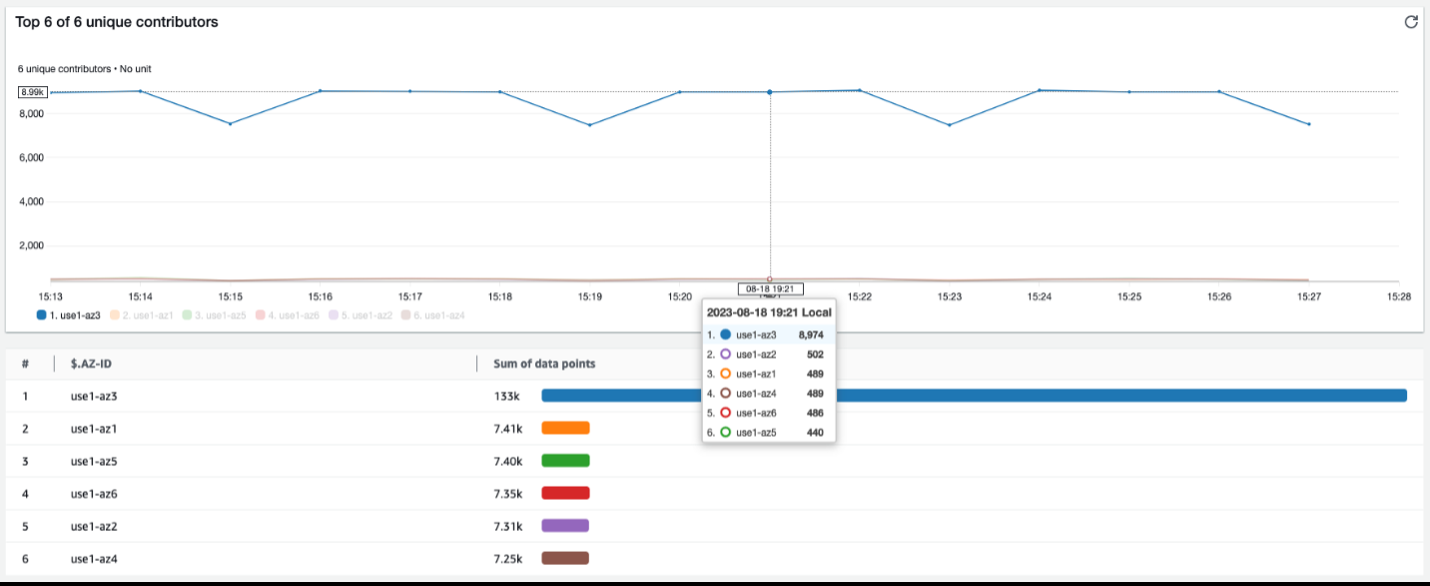
This resulting graph would look similar to the following graph during a gray failure.

Figure 4 – Graphing Availability Zone contributors to fault rate

This graph shows us that use1-az3 also has an almost 20x fault rate compared to any of the other Availability Zones being used. When you see this kind of result, the same automation mentioned in the previous section can be used to detect which Availability Zone is being impacted. In response, you can use a service like zonal shift in Amazon Route 53 Application Recovery Controller to evacuate the impaired Availability Zone. There are other mechanisms to evacuate an Availability Zone depending on your architecture and requirements outlined in the  Advanced Multi-AZ Resilience Patterns white paper .

Next steps
In this post, we described how CloudWatch Contributor Insights can be used to identify outliers and find gray failures. This helps you turn gray failures into detected failures that you can accurately respond to and mitigate. Learn more about CloudWatch Contributor Insights here . You can get hands-on experience with using CloudWatch Contributor Insights and other tools like composite alarms to detect gray failures—take a look at this workshop . These patterns will help you build workloads that are more resilient to single-instance and single-AZ gray failures.

About the authors


Michael Haken

Michael is a Principal Solutions Architect on the Amazon Web Services Strategic Accounts team where he helps customers innovate, differentiate their business, and transform their customer experiences. He has over 15 years’ experience supporting financial services, public sector, and digital native customers. Michael has his B.A. from UVA and M.S. in Computer Science from Johns Hopkins. Outside of work you’ll find him playing with his family and dogs on his farm.


Raghu Iyer

Raghu Iyer is Senior Partner Solutions Architect at Amazon Web Services, supporting customers in their digital transformation journey. He brings over 22 years of experience in leading digital transformation programs and architecting solutions for different industries. He is passionate about helping customers achieve their business goals by implementing robust, scalable, and innovative solutions.