Create your own reusable visual transforms for Amazon Web Services Glue Studio

by Gonzalo Herreros and Michael Benattar | on

Amazon Web Services Glue Studio has recently added the possibility of adding custom transforms that you can use to build visual jobs to use them in combination with the Amazon Web Services Glue Studio components provided out of the box. You can now define custom visual transform by simply dropping a JSON file and a Python script onto Amazon S3, which defines the component and the processing logic, respectively.

Custom visual transform lets you define, reuse, and share business-specific ETL logic among your teams. With this new feature, data engineers can write reusable transforms for the Amazon Web Services Glue visual job editor. Reusable transforms increase consistency between teams and help keep jobs up-to-date by minimizing duplicate effort and code.

In this blog post, I will show you a fictional use case that requires the creation of two custom transforms to illustrate what you can accomplish with this new feature. One component will generate synthetic data on the fly for testing purposes, and the other will prepare the data to store it partitioned.

Use case: Generate synthetic data on the fly

There are multiple reasons why you would want to have a component that generates synthetic data. Maybe the real data is heavily restricted or not yet available, or there is not enough quantity or variety at the moment to test performance. Or maybe using the real data imposes some cost or load to the real system, and we want to reduce its usage during development.

Using the new custom visual transforms framework, let’s create a component that builds synthetic data for fictional sales during a natural year.

Define the generator component

First, define the component by giving it a name, description, and parameters. In this case, use salesdata_generator for both the name and the function, with two parameters: how many rows to generate and for which year.

For the parameters, we define them both as int, and you can add a regex validation to make sure the parameters provided by the user are in the correct format.

There are further configuration options available; to learn more, refer to the Amazon Web Services Glue User Guide .

This is how the component definition would look like. Save it as salesdata_generator.json. For convenience, we’ll match the name of the Python file, so it’s important to choose a name that doesn’t conflict with an existing Python module.
If the year is not specified, the script will default to last year.

{
  "name": "salesdata_generator",
  "displayName": "Synthetic Sales Data Generator",
  "description": "Generate synthetic order datasets for testing purposes.",
  "functionName": "salesdata_generator",
  "parameters": [
    {
      "name": "numSamples",
      "displayName": "Number of samples",
      "type": "int",
      "description": "Number of samples to generate"
    },
    {
      "name": "year",
      "displayName": "Year",
      "isOptional": true,
      "type": "int",
      "description": "Year for which generate data distributed randomly, by default last year",
      "validationRule": "^\\d{4}$",
      "validationMessage": "Please enter a valid year number"
    }
  ]
}

Implement the generator logic

Now, you need to create a Python script file with the implementation logic.
Save the following script as salesdata_generator.py. Notice the name is the same as the JSON, just with a different extension.

from awsglue import DynamicFrame
import pyspark.sql.functions as F
import datetime
import time

def salesdata_generator(self, numSamples, year=None):
    if not year:
        # Use last year
        year = datetime.datetime.now().year - 1
    
    year_start_ts = int(time.mktime((year,1,1,0,0,0,0,0,0)))
    year_end_ts = int(time.mktime((year + 1,1,1,0,0,0,0,0,0)))
    ts_range = year_end_ts - year_start_ts
    
    departments = ["bargain", "checkout", "food hall", "sports", "menswear", "womenwear", "health and beauty", "home"]
    dep_array = F.array(*[F.lit(x) for x in departments])
    dep_randomizer = (F.round(F.rand() * (len(departments) -1))).cast("int")

    df = self.glue_ctx.sparkSession.range(numSamples) \
      .withColumn("sale_date", F.from_unixtime(F.lit(year_start_ts) + F.rand() * ts_range)) \
      .withColumn("amount_dollars", F.round(F.rand() * 1000, 2)) \
      .withColumn("department", dep_array.getItem(dep_randomizer))  
    return DynamicFrame.fromDF(df, self.glue_ctx, "sales_synthetic_data")

DynamicFrame.salesdata_generator = salesdata_generator

The function salesdata_generator in the script receives the source DynamicFrame as “self”, and the parameters must match the definition in the JSON file. Notice the “year” is an optional parameter, so it has assigned a default function on call, which the function detects and replaces with the previous year. The function returns the transformed DynamicFrame. In this case, it’s not derived from the source one, which is the common case, but replaced by a new one.

The transform leverages Spark functions as well as Python libraries in order to implement this generator.
To keep things simple, this example only generates four columns, but we could do the same for many more by either hardcoding values, assigning them from a list, looking for some other input, or doing whatever makes sense to make the data realistic.

Deploy and using the generator transform

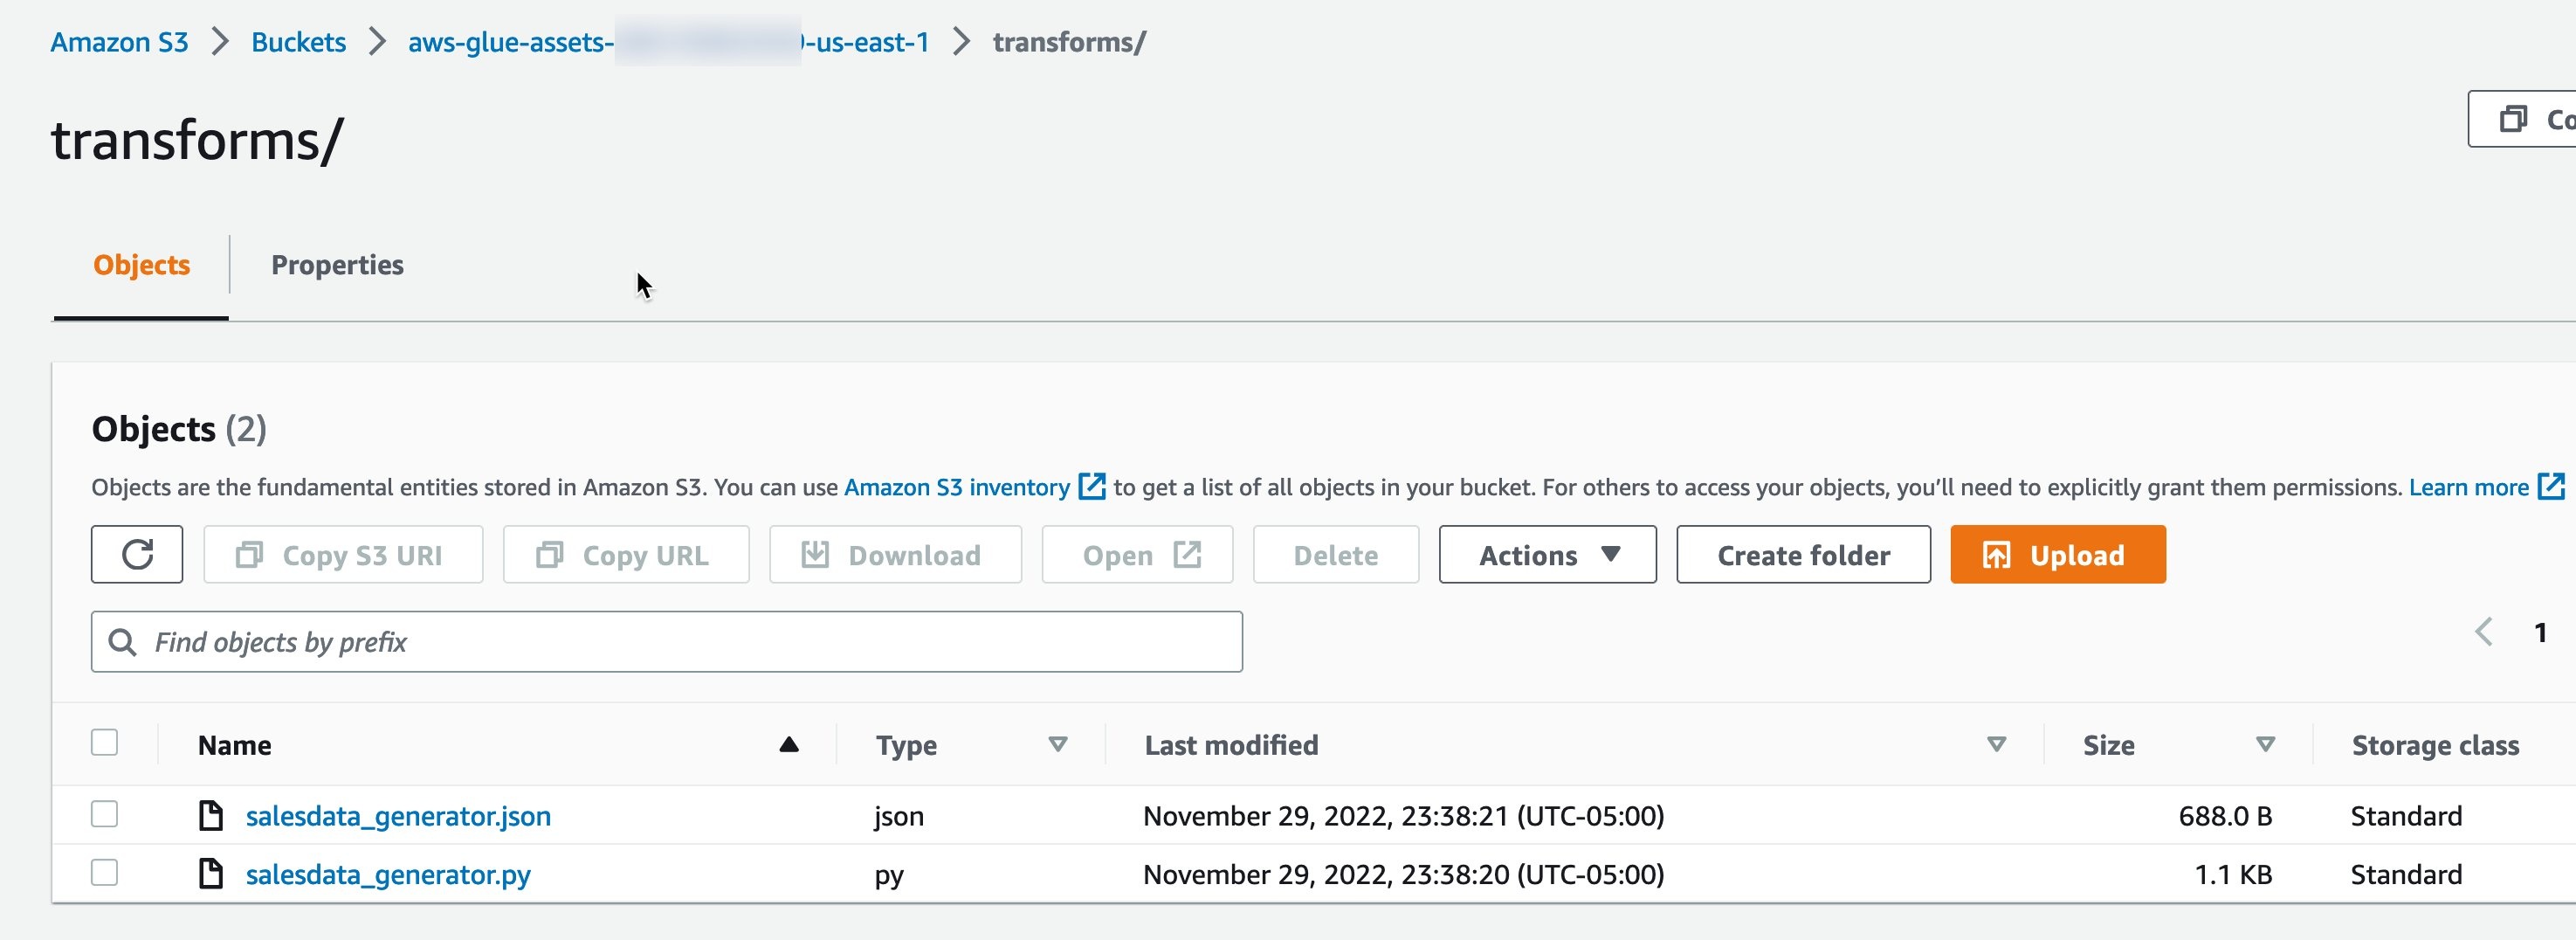
Now that we have both files ready, all we have to do is upload them on Amazon S3 under the following path.

s3://aws-glue-assets-<account id>-<region name>/transforms/

If Amazon Web Services Glue has never been used in the account and Region, then that bucket might not exist and needs to be created. Amazon Web Services Glue will automatically create this bucket when you create your first job.

You will need to manually create a folder called “transforms” in that bucket to upload the files into.

Once you have uploaded both files, the next time we open (or refresh) the page on Amazon Web Services Glue Studio visual editor, the transform should be listed among the other transforms. You can search for it by name or description.

Because this is a transform and not a source, when we try to use the component, the UI will demand a parent node. You can use as a parent the real data source (so you can easily remove the generator and use the real data) or just use a placeholder. I’ll show you how:

  1. Go to the Amazon Web Services Glue, and in the left menu, select Jobs under Amazon Web Services Glue Studio.
  2. Leave the default options (Visual with a source and target and S3 source and destination), and choose Create.
  3. Give the job a name by editing Untitled job at the top left; for example, CustomTransformsDemo
  4. Go to the Job details tab and select a role with Amazon Web Services Glue permissions as the IAM role. If no role is listed on the dropdown, then follow these instructions to create one.
    For this demo, you can also reduce Requested number of workers to 2 and Number of retries to 0 to minimize costs.
  5. Delete the Data target node S3 bucket at the bottom of the graph by selecting it and choosing Remove. We will restore it later when we need it.
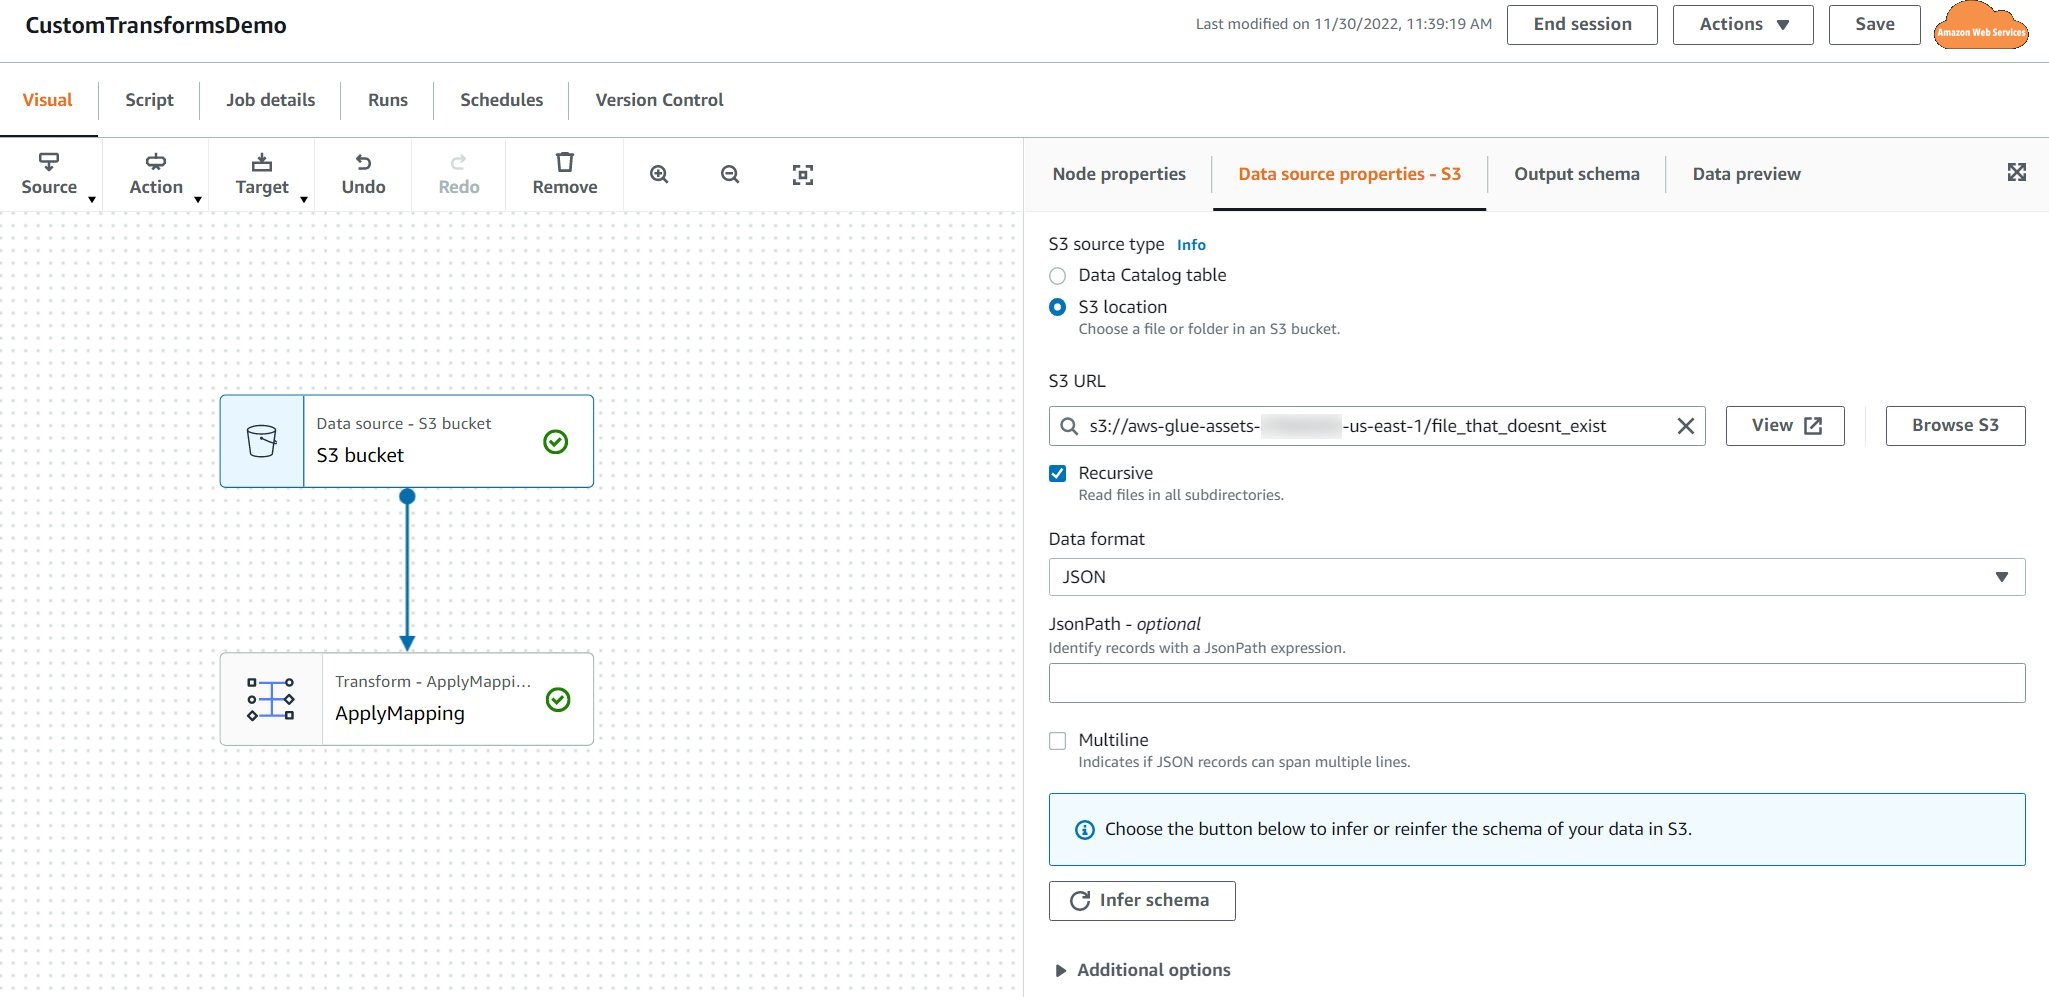
  6. Edit the S3 source node by selecting it in the Data source properties tab and selecting source type S3 location.
    In the S3 URL box, enter a path that doesn’t exist on a bucket the role selected can access, for instance: s3://aws-glue-assets-<account id>-<region name>/file_that_doesnt_exist. Notice there is no trailing slash.
    Choose JSON as the data format with default settings; it doesn’t matter.
    You might get a warning that it cannot infer schema because the file doesn’t exist; that’s OK, we don’t need it.
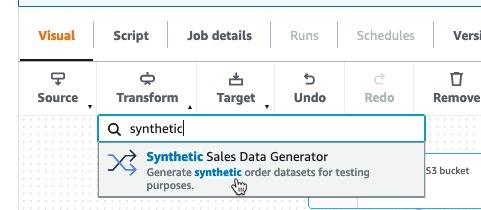
  7. Now search for the transform by typing “synthetic” in the search box of transforms. Once the result appears (or you scroll and search it on the list), choose it so it is added to the job.
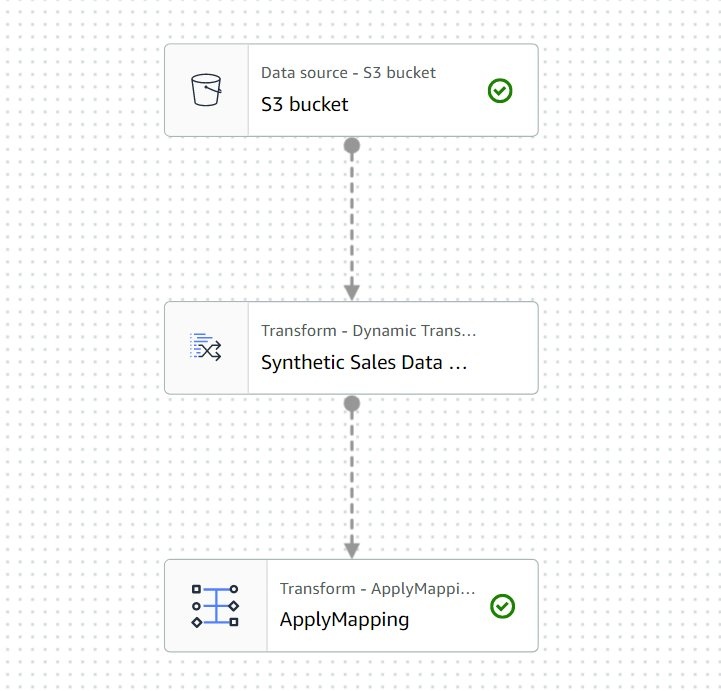
  8. Set the parent of the transform just added to be S3 bucket source in the Node properties tab. Then for the ApplyMapping node, replace the parent S3 bucket with transforms Synthetic Sales Data Generator. Notice this long name is coming from the displayName defined in the JSON file uploaded before.
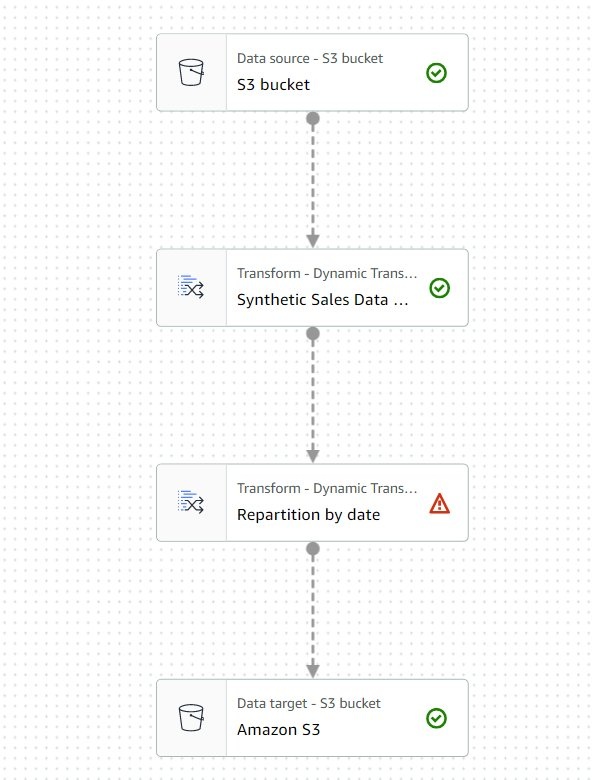
  9. After these changes, your job diagram should look as follows (if you tried to save, there might be some warnings; that’s OK, we’ll complete the configuration next).
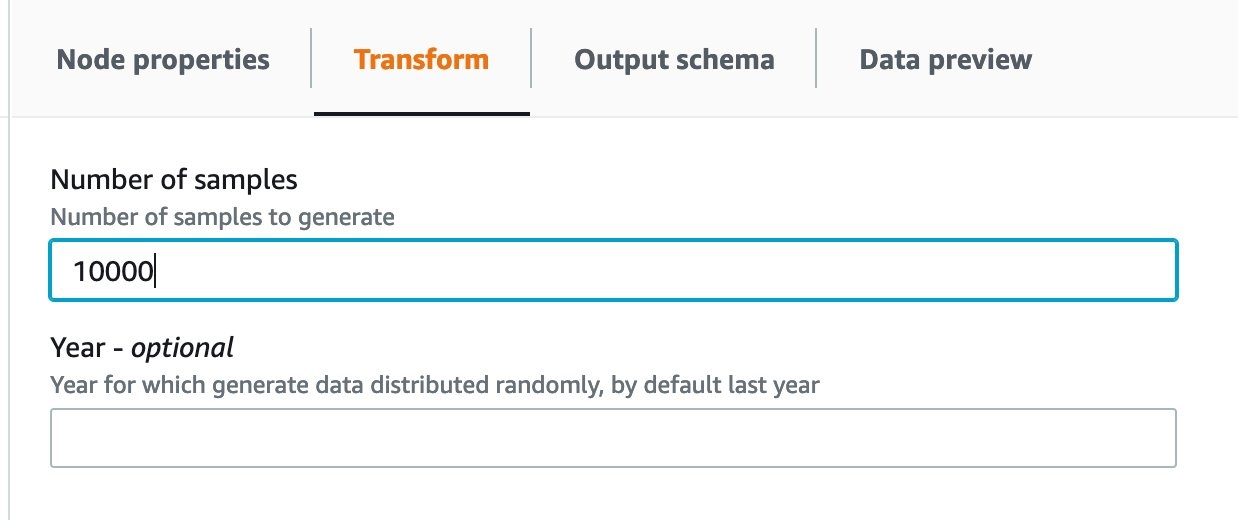
  10. Select the Synthetic Sales node and go to the Transform tab. Enter 10000 as the number of samples and leave the year by default, so it uses last year.
  11. Now we need the generated schema to be applied. This would be needed if we had a source that matches the generator schema.
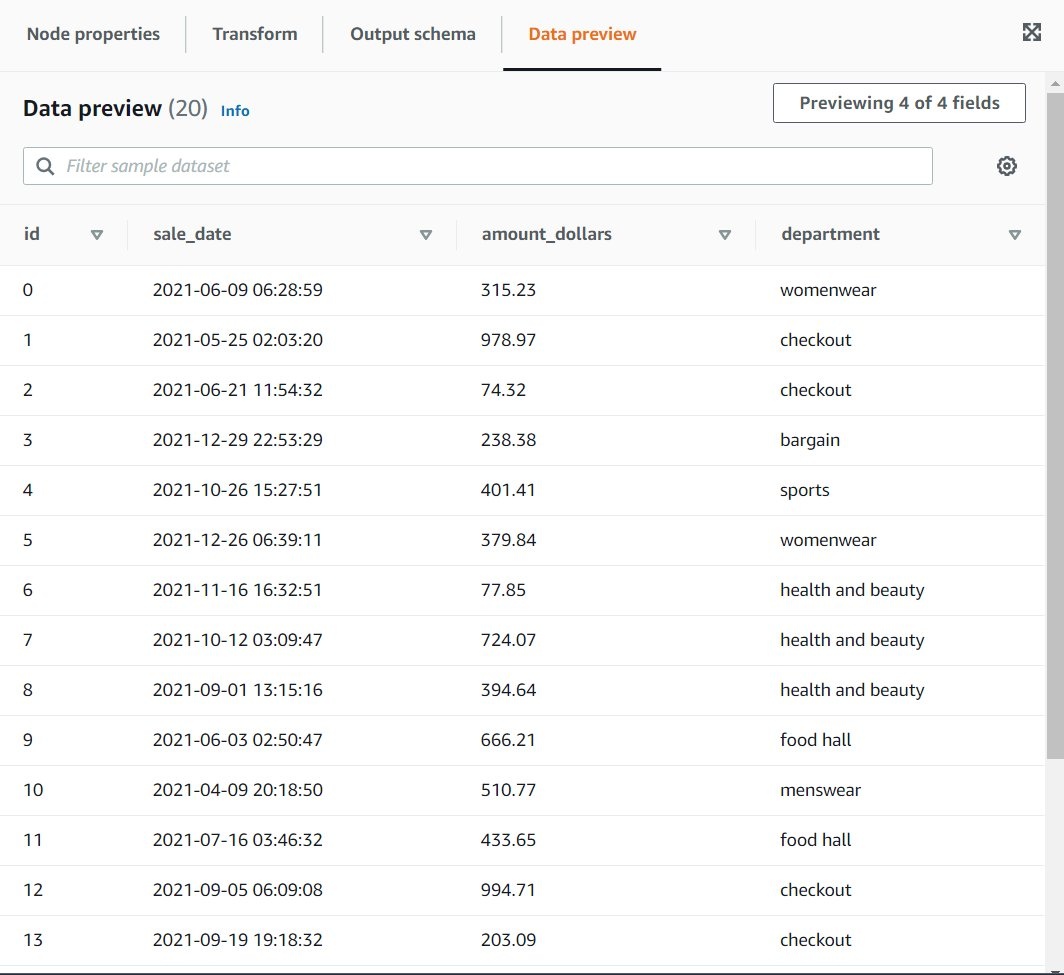
    In the same node, select the tab Data preview and start a session. Once it is running, you should see sample synthetic data. Notice the sale dates are randomly distributed across the year.
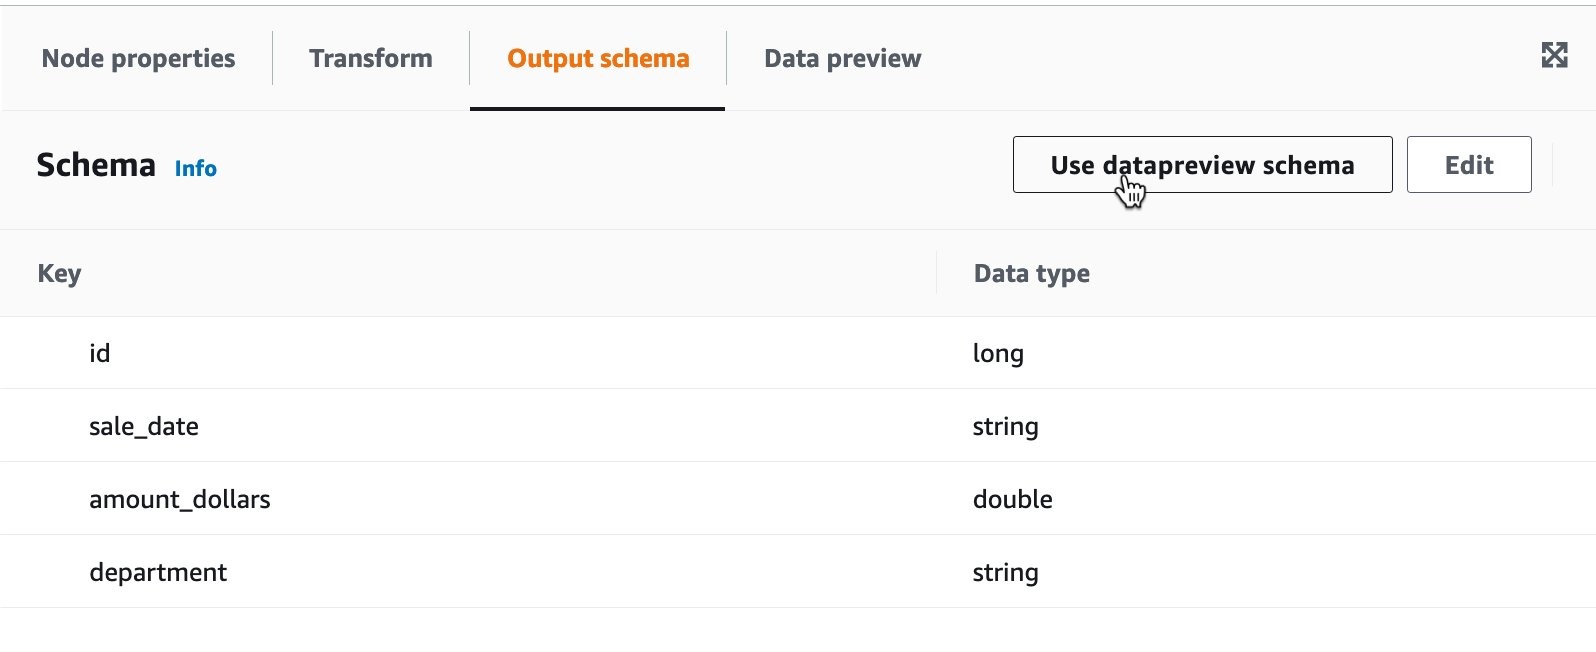
  12. Now select the tab Output schema and choose Use datapreview schema That way, the four fields generated by the node will be propagated, and we can do the mapping based on this schema.
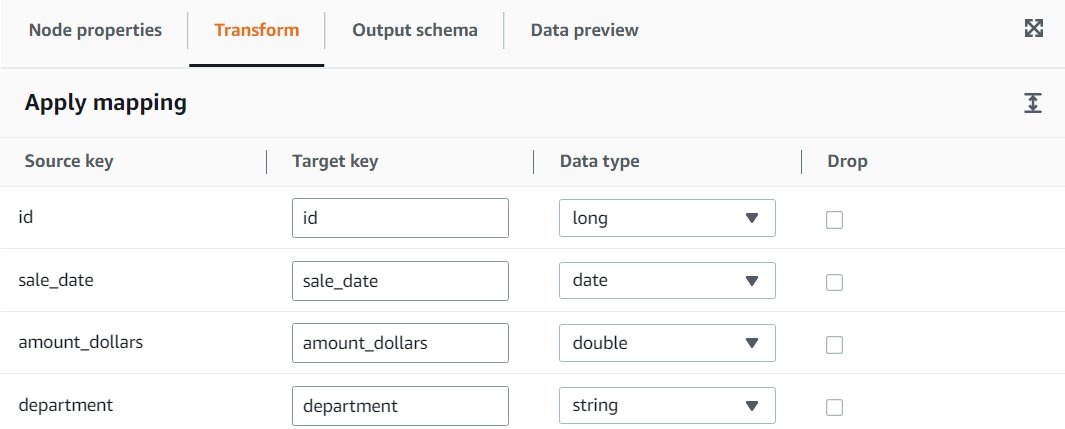
  13. Now we want to convert the generated sale_date timestamp into a date column, so we can use it to partition the output by day. Select the node ApplyMapping in the Transform tab. For the sale_date field, select date as the target type. This will truncate the timestamp to just the date.
  14. Now it’s a good time to save the job. It should let you save successfully.

Finally, we need to configure the sink. Follow these steps:

  1. With the ApplyMapping node selected, go to the Target dropdown and choose Amazon S3. The sink will be added to the ApplyMapping node. If you didn’t select the parent node before adding the sink, you can still set it in the Node details tab of the sink.
  2. Create an S3 bucket in the same Region as where the job will run. We’ll use it to store the output data, so we can clean up easily at the end. If you create it via the console, the default bucket config is OK.
    You can read more information about bucket creation on the Amazon S3 documentation 
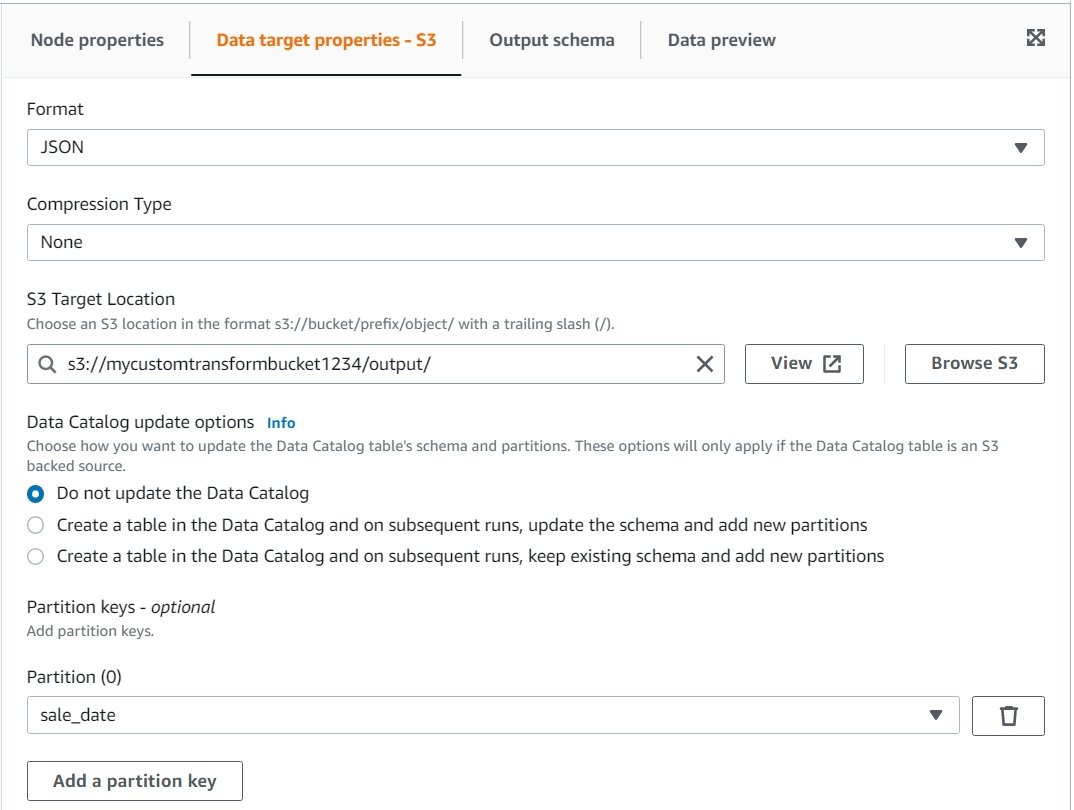
  3. In the Data target properties tab, enter in S3 Target Location the URL of the bucket and some path and a trailing slash, for instance: s3://<your output bucket here>/output/
    Leave the rest with the default values provided.
  4. Choose Add partition key at the bottom and select the field sale_date.

We could create a partitioned table at the same time just by selecting the corresponding catalog update option. For simplicity, generate the partitioned files at this time without updating the catalog, which is the default option.

You can now save and then run the job.

Once the job has completed, after a couple of minutes (you can verify this in the Runs tab), explore the S3 target location entered above. You can use the Amazon S3 console or the Amazon Web Services CLI. You will see files named like this: s3://<your output bucket here>/output/sale_date=<some date yyyy-mm-dd>/<filename>.

If you count the files, there should be close to but not more than 1,460 (depending on the year used and assuming you are using 2 G.1X workers and Amazon Web Services Glue version 3.0)

Use case: Improve the data partitioning

In the previous section, you created a job using a custom visual component that produced synthetic data, did a small transformation on the date, and saved it partitioned on S3 by day.

You might be wondering why this job generated so many files for the synthetic data. This is not ideal, especially when they are as small as in this case. If this data was saved as a table with years of history, generating small files has a detrimental impact on tools that consume it, like Amazon Athena.

The reason for this is that when the generator calls the “range” function in Apache Spark without specifying a number of memory partitions (notice they are a different kind from the output partitions saved to S3), it defaults to the number of cores in the cluster, which in this example is just 4.

Because the dates are random, each memory partition is likely to contain rows representing all days of the year, so when the sink needs to split the dates into output directories to group the files, each memory partition needs to create one file for each day present, so you can have 4 * 365 (not in a leap year) is 1,460.

This example is a bit extreme, and normally data read from the source is not so spread over time. The issue can often be found when you add other dimensions, such as output partition columns.

Now you are going to build a component that optimizes this, trying to reduce the number of output files as much as possible: one per output directory.
Also, let’s imagine that on your team, you have the policy of generating S3 date partition separated by year, month, and day as strings, so the files can be selected efficiently whether using a table on top or not.

We don’t want individual users to have to deal with these optimizations and conventions individually but instead have a component they can just add to their jobs.

Define the repartitioner transform

For this new transform, create a separate JSON file, let’s call it repartition_date.json, where we define the new transform and the parameters it needs.

{
  "name": "repartition_date",
  "displayName": "Repartition by date",
  "description": "Split a date into partition columns and reorganize the data to save them as partitions.",
  "functionName": "repartition_date",
  "parameters": [
    {
      "name": "dateCol",
      "displayName": "Date column",
      "type": "str",
      "description": "Column with the date to split into year, month and day partitions. The column won't be removed"
    },
    {
      "name": "partitionCols",
      "displayName": "Partition columns",
      "type": "str",
      "isOptional": true,
      "description": "In addition to the year, month and day, you can specify additional columns to partition by, separated by commas"
    },
    {
      "name": "numPartitionsExpected",
      "displayName": "Number partitions expected",
      "isOptional": true,
      "type": "int",
      "description": "The number of partition column value combinations expected, if not specified the system will calculate it."
    }
  ]
}

Implement the transform logic

The script splits the date into multiple columns with leading zeros and then reorganizes the data in memory according to the output partitions. Save the code in a file named repartition_date.py:

from awsglue import DynamicFrame
import pyspark.sql.functions as F

def repartition_date(self, dateCol, partitionCols="", numPartitionsExpected=None):
    partition_list = partitionCols.split(",") if partitionCols else []
    partition_list += ["year", "month", "day"]
    
    date_col = F.col(dateCol)
    df = self.toDF()\
      .withColumn("year", F.year(date_col).cast("string"))\
      .withColumn("month", F.format_string("%02d", F.month(date_col)))\
      .withColumn("day", F.format_string("%02d", F.dayofmonth(date_col)))
    
    if not numPartitionsExpected:
        numPartitionsExpected = df.selectExpr(f"COUNT(DISTINCT {','.join(partition_list)})").collect()[0][0]
    
    # Reorganize the data so the partitions in memory are aligned when the file partitioning on s3
    # So each partition has the data for a combination of partition column values
    df = df.repartition(numPartitionsExpected, partition_list)    
    return DynamicFrame.fromDF(df, self.glue_ctx, self.name)

DynamicFrame.repartition_date = repartition_date

Upload the two new files onto the S3 transforms folder like you did for the previous transform.

Deploy and use the generator transform

Now edit the job to make use of the new component to generate a different output.
Refresh the page in the browser if the new transform is not listed.

  1. Select the generator transform and from the transforms dropdown, find Repartition by date and choose it; it should be added as a child of the generator.
    Now change the parent of the Data target node to the new node added and remove the ApplyMapping; we no longer need it.
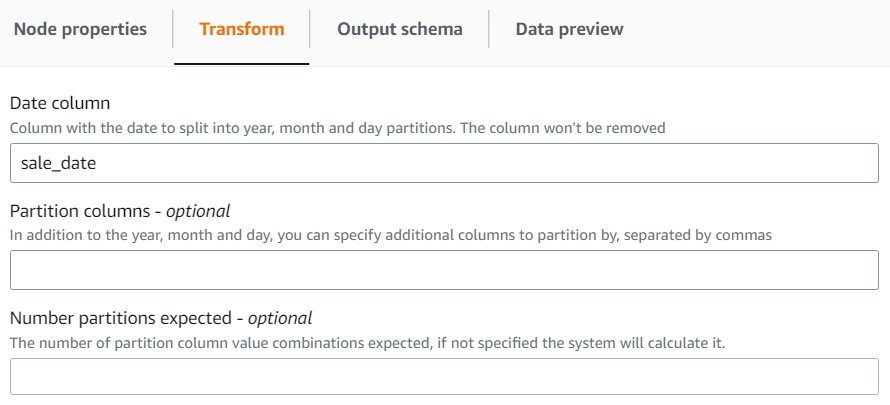
  2. Repartition by date needs you to enter the column that contains the timestamp.
    Enter sale_date (the framework doesn’t yet allow field selection using a dropdown) and leave the other two as defaults.
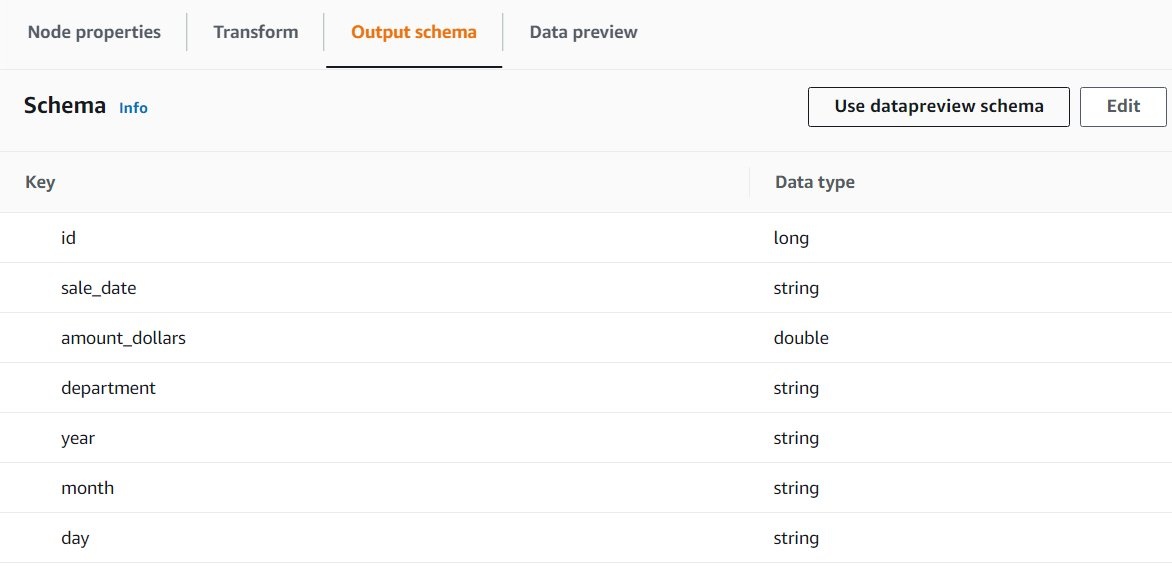
  3. Now we need to update the output schema with the new date split fields. To do so, use the Data preview tab to check it’s working correctly (or start a session if the previous one has expired). Then in the Output schema, choose Use datapreview schema so the new fields get added. Notice the transform doesn’t remove the original column, but it could if you change it to do so.
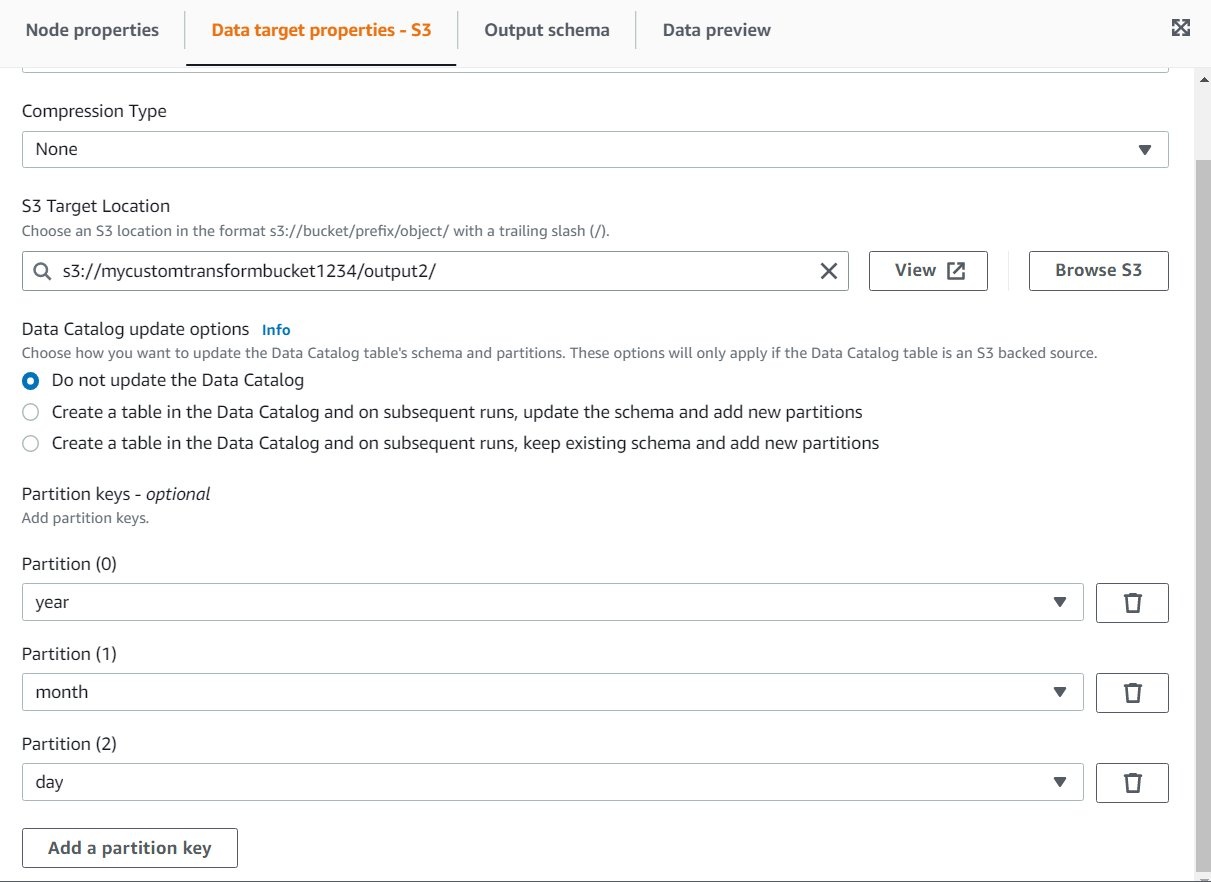
  4. Finally, edit the S3 target to enter a different location so the folders don’t mix with the previous run, and it’s easier to compare and use. Change the path to /output2/.
    Remove the existing partition column and instead add year, month, and day.

Save and run the job. After one or two minutes, once it completes, examine the output files. They should be much closer to the optimal number of one per day, maybe two. Consider that in this example, we only have four partitions. In a real dataset, the number of files without this repartitioning would explode very easily.
Also, now the path follows the traditional date partition structure, for instance: output2/year=2021/month=09/day=01/run-AmazonS3_node1669816624410-4-part-r-00292

Notice that at the end of the file name is the partition number. While we now have more partitions, we have fewer output files because the data is organized in memory more aligned with the desired output.

The repartition transform has additional configuration options that we have left empty. You can now go ahead and try different values and see how they affect the output.
For instance, you can specify “department ” as “Partition columns” in the transform and then add it in the sink partition column list. Or you can enter a “Number of partitions expected” and see how it affects the runtime (it no longer needs to determine this at runtime) and the number of files produced as you enter a higher number, for instance, 3,000.

How this feature works under the hood

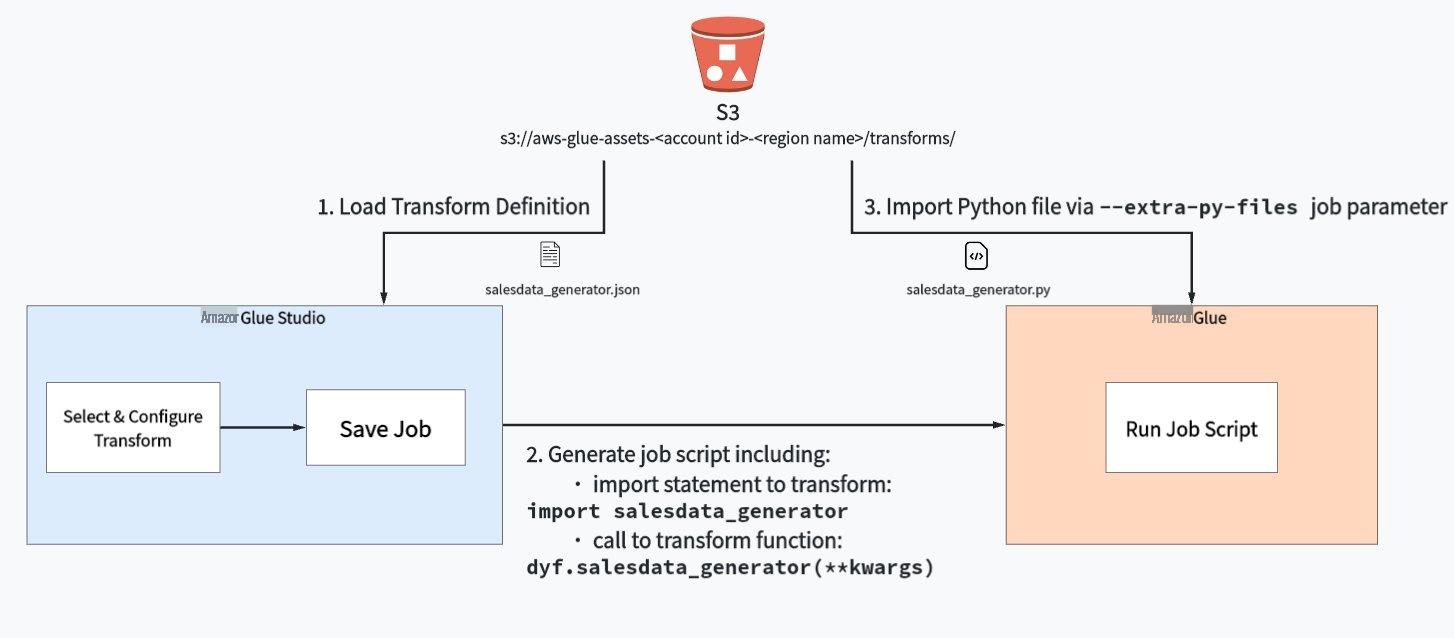
  1. Upon loading the Amazon Web Services Glue Studio visual job authoring page, all your transforms stored in the aforementioned S3 bucket will be loaded in the UI. Amazon Web Services Glue Studio will parse the JSON definition file to display transform metadata such as name, description, and list of parameters.
  2. Once the user is done creating and saving his job using custom visual transforms, Amazon Web Services Glue Studio will generate the job script and update the Python library path (also referred as  —extra-py-files job parameters ) with the list of transform Python file S3 paths, separated by comma.
  3. Before running your script, Amazon Web Services Glue will add all file paths stored in the  —extra-py-files job parameters to the Python path, allowing your script to run all custom visual transform functions you defined.

Cleanup

In order to avoid running costs, if you don’t want to keep the generated files, you can empty and delete the output bucket created for this demo. You might also want to delete the Amazon Web Services Glue job created.

Conclusion

In this post, you have seen how you can create your own reusable visual transforms and then use them in Amazon Web Services Glue Studio to enhance your jobs and your team’s productivity.

You first created a component to use synthetically generated data on demand and then another transform to optimize the data for partitioning on Amazon S3.


About the authors

Gonzalo Herreros is a Senior Big Data Architect on the Amazon Web Services Glue team.

Michael Benattar is a Senior Software Engineer on the Amazon Web Services Glue Studio team. He has led the design and implementation of the custom visual transform feature.