我们使用机器学习技术将英文博客翻译为简体中文。您可以点击导航栏中的“中文(简体)”切换到英文版本。
使用机器学习和亚马逊 Neptune 图形技术自动发现数据关系
数据网格是一种新的数据管理方法。各行各业的公司都在使用数据网格来分散数据管理,以提高数据灵活性并从数据中获取价值。但是,当数据生产者在数据网格自助门户网站上共享数据产品时,数据使用者要知道他们可以加入哪些数据产品来创造新的见解既不直观也不容易。在拥有数千种数据产品的大型企业中尤其如此。
这篇文章介绍如何使用机器学习 (ML) 和
背景
数据驱动型组织的成功将数据视为促进和维持创新的关键推动力。它遵循所谓的 分布式系统架构 。数据产品的目标是解决长期存在的数据孤岛和数据质量问题。通常,只有当你能够将独立数据产品连接起来、加入它们并关联它们以创建更高阶的数据产品来创造更多见解时,它们才有价值。现代数据架构对于成为数据驱动型组织至关重要。它允许利益相关者管理和使用整个组织的数据产品,从而加快创新的步伐和规模。
解决方案概述
数据网格架构开始通过将数据基础设施与应用程序基础设施解耦来解决解耦架构,这是传统数据架构中常见的挑战。它专注于去中心化所有权、域名设计、数据产品和自助数据基础设施。这允许一种新的思维方式和新的组织元素,即现代数据社区。
但是,当今的数据网格平台包含很大程度上独立的数据产品。即使使用有据可查的数据产品,知道如何连接或加入数据产品也是一项耗时的工作。数据使用者花费数小时、数天或数月来理解和分析数据。识别数据产品之间的联系或关系对于从数据网格中创造价值和支持数据驱动型组织至关重要。
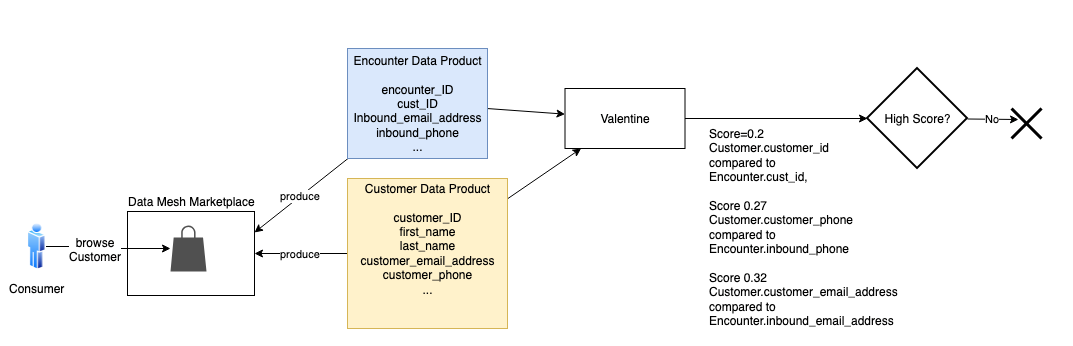
这篇文章中的解决方案说明了解决这些挑战的方法。它使用一家虚构的保险公司,在其数据网格市场上共享多个数据产品。下图显示了我们的解决方案中使用的示例数据产品。
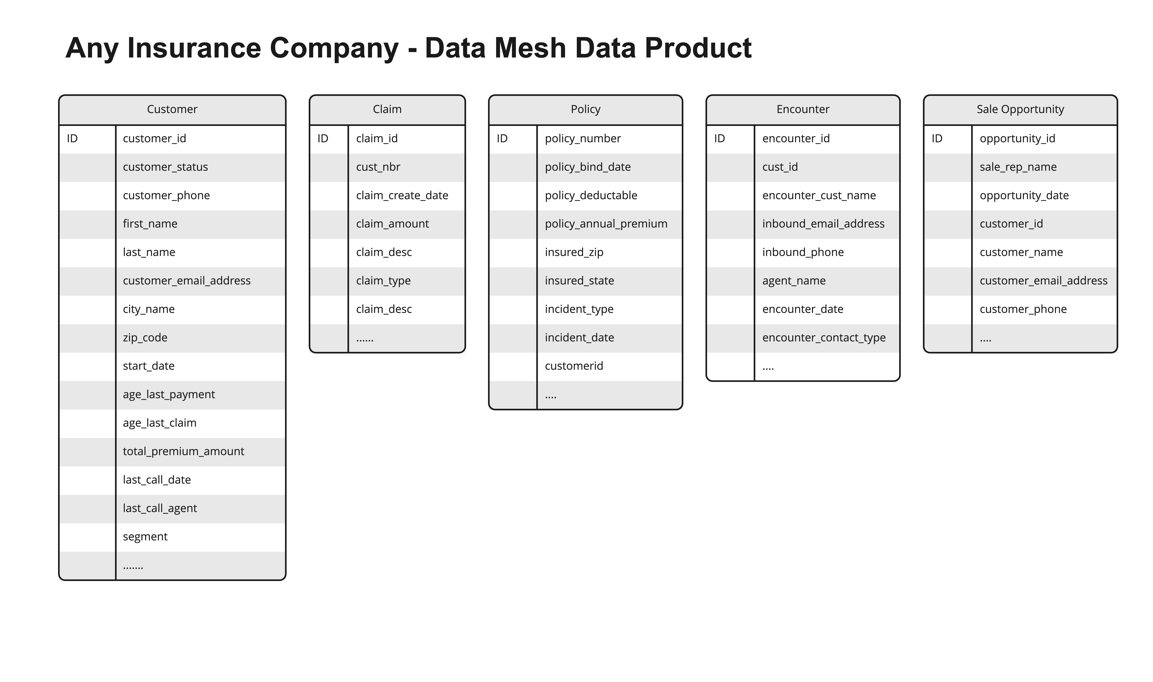
假设消费者正在数据网格市场中浏览客户数据产品。消费者想知道客户数据是否可以与索赔、保单或遭遇数据相关联。由于这些数据产品来自不同的业务线 (LOB) 或孤岛,因此很难知道。消费者必须查看每种数据产品并进行必要的分析和研究,才能确定地知道这一点。
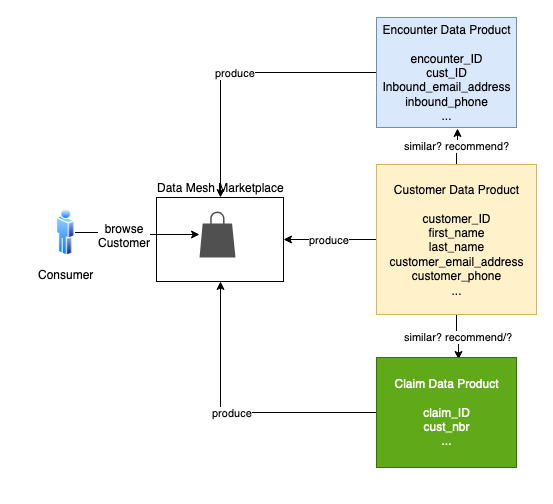
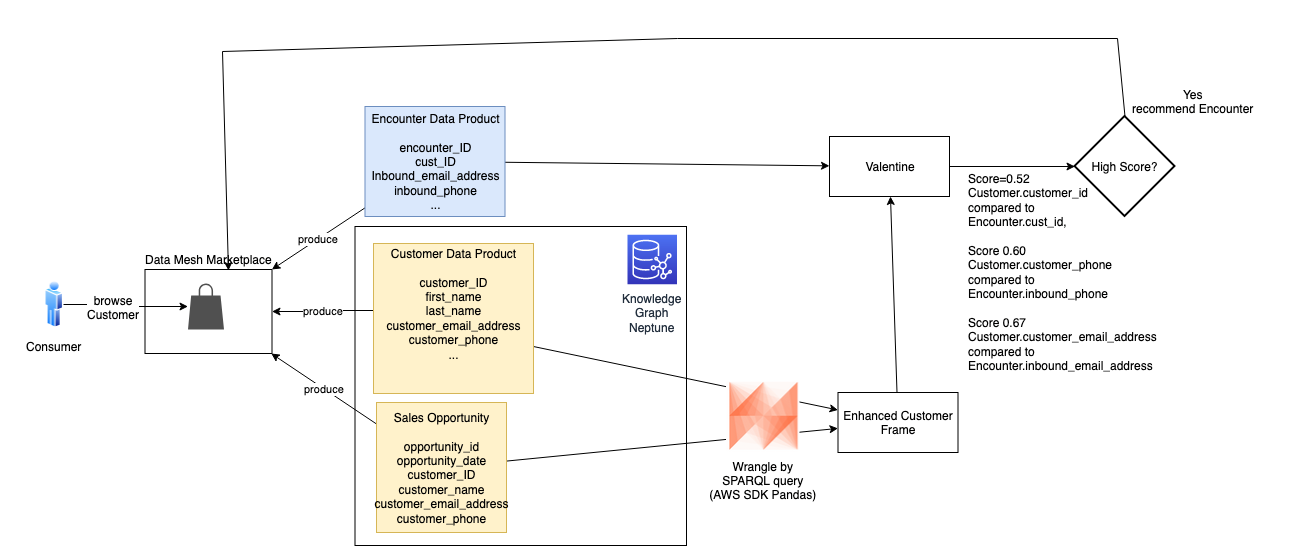
为了解决这个问题,我们的解决方案使用机器学习和海王星为数据使用者创建建议。该解决方案生成数据产品、产品属性和相关概率分数的列表以显示联接能力。这缩短了发现、分析和创造新见解的时间。
我们使用情人节(一种用于比较数据集的数据科学算法)来改进数据产品推荐。Neptune 是托管的 亚马逊云科技 图形数据库服务,用于存储有关数据集之间显式连接的信息,从而改进了建议。
示例用例
让我们举一个具体的例子。假设消费者正在数据网格市场中浏览客户数据产品。客户与 “政策” 和 “遭遇” 数据产品类似,但这些产品来自不同的孤岛。它们与客户的相似度很难估量。为了加快消费者的工作,网格推荐了如何将 Policy and Encounter 产品连接到客户产品。
让我们考虑两个案例。首先,客户与索赔相似吗?以下是每种产品中的数据示例。
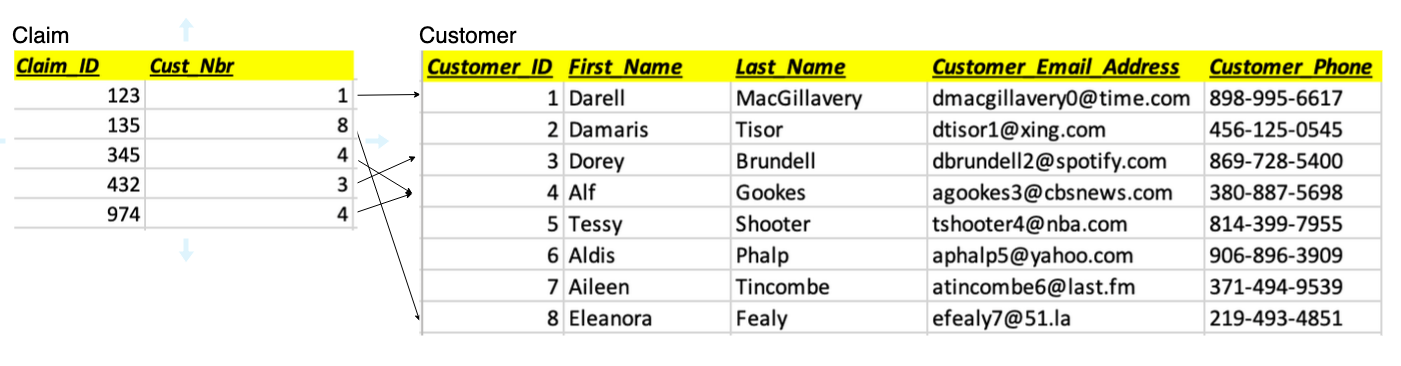
直观地讲,这两种产品有很多重叠之处。索赔 中的每个
Cust_Nbr
在客户中都有相应的
客户
ID。索赔中没有外键限制可以向我们保证它指向客户。我们认为有足够的相似性可以推断出联接关系。
数据科学算法 Valentine 是实现此目的的有效工具。论文《情人
该解决方案使用了以下
alentine_match () 函数并选择匹配
方法。我们使用 COMA,这是瓦伦丁支持的几种方法之一。该函数的结果表示列和分数的相似性。在这种情况下,它告诉我们
客户的customer_ID
与索赔 的Cu
st_Nbr
相匹配,得分非常高。然后,我们指示数据网格向消费者浏览客户推荐 Claim。
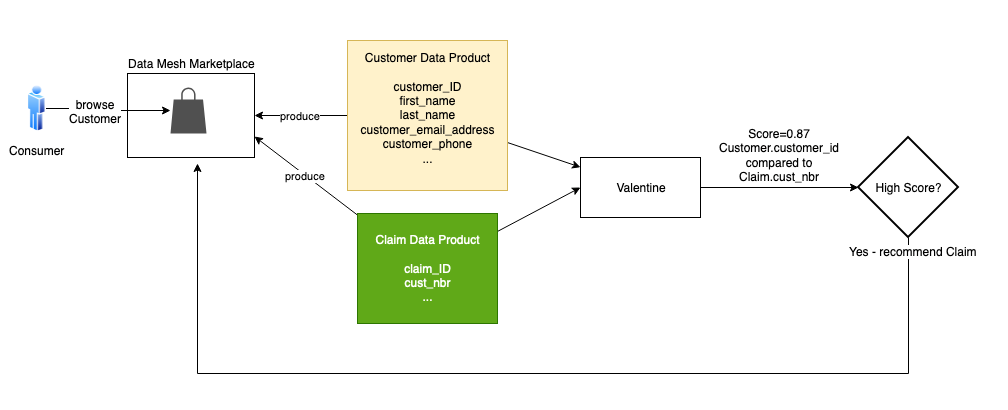
无需图形数据库即可推荐 Claim;可以直接比较这两种产品。但是让我们考虑一下 “遭遇”。客户与 Encounter 相似吗?这种情况要复杂得多。Encounter 产品中的许多遭遇都与客户无关。当有人通过电话或电子邮件联系联络中心时,就会发生相遇。当事人可能是也可能不是客户,如果他们是客户,在这次会面中我们可能不知道他们的客户 ID。此外,有时他们使用的电话或电子邮件与客户产品中客户记录中的电话或电子邮件不同。
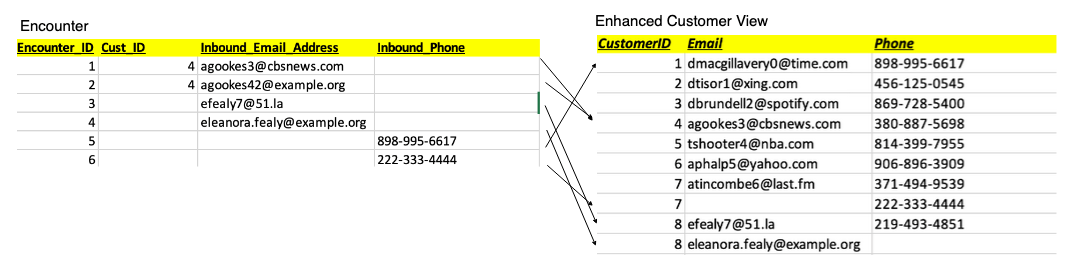
在以下示例遭遇集中,遇到 1 和 2 与 c
ustomer_ID
4 相匹配。请注意,遭遇 2 的入站电子邮件与该客户在客户产品中的记录 中的
入站电子邮件不
完全匹配。Encounter 3 没有
customer_ID
,但它的入站电子邮件地址与 ID 为 8 的客户相匹配。Encounter 4 似乎指 的是 ID 为 8 的客户,但电子邮件不匹配,也没有给出 c
ustomer_ID
。Encounter 5 只有
Inbound_Phon
e ,但这会匹配身份为 1 的客户。Encounter 6 只有
Inbound_Phon
e ,而且它似乎与我们迄今为止列出的任何客户都不匹配。
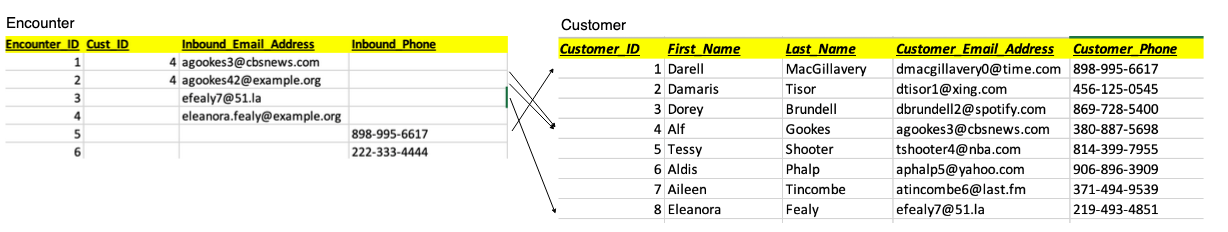
我们没有足够强的比较来推断出相似性。
但是,我们对客户的了解比客户产品告诉我们的要多。在海王星数据库中,我们维护着一个知识图谱,该图谱结合了多种产品并通过关系将它们联系起来。知识图谱使我们能够组合来自不同来源的数据,以更好地了解特定的问题领域。在 Neptune 中,我们将客户产品数据与其他数据产品相结合:销售机会。我们将每种产品从其来源吸收到知识图谱中,并对客户和销售
机会资源之间的 HassalesOpportunity
关系进行建模。下图显示了这些资源及其属性和关系。
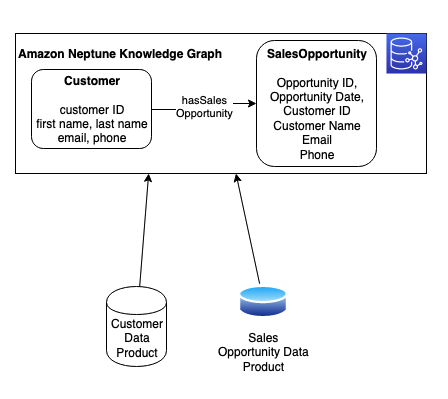
使用适用于 Pandas 的 亚马逊云科技 开发工具包,我们通过对海王星图表运行查询来合并这些数据。我们使用图表查询语言(例如 SPARQL)将客户和销售机会数据的代表性子集整理到 Pandas 数据框中(如下图所示,如 增强型客户视图 所示)。在以下示例中,我们使用来自销售机会的备用电话或电子邮件联系数据增强客户 7 和 8。
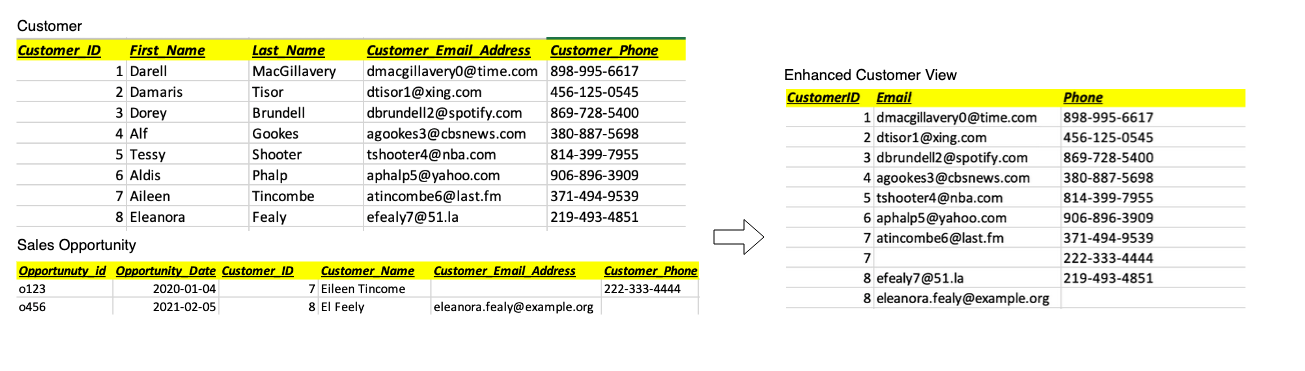
我们将该帧传递给情人节然后将其与 Encounter 进行比较。这次,又有两次会面匹配一位客户。
分数符合我们的门槛,并且足够高,可以作为可能的匹配项与消费者分享。对于在网状市场中浏览客户的客户,我们提供 Encounter 的推荐以及支持该推荐的评分详情。有了这个建议,消费者可以更有信心地探索 Encounter 产品。
结论
数据驱动型组织正在向数据产品思维方式过渡。利用诸如数据网格之类的策略可以大规模产生价值。我们更进一步,创建了蓝图,通过使用图形技术和机器学习关联相似的数据产品来创建智能推荐。在这篇文章中,我们展示了组织如何通过自动化流程使用机器学习和海王星来增加数据目录,增加额外的元数据。
该解决方案解决了数据产品的互操作性和链接问题。此外,它可以为组织提供实时见解、敏捷性和创新性,而无需花费时间进行数据分析和研究。这种方法创建了一个真正互联的生态系统,简化了访问权限,使您的数据消费者感到满意。
要了解有关海王星机器学习的更多信息,请参阅 Am
作者简介
 Moira Lennox
是 亚马逊云科技 的高级数据策略技术专家,拥有 27 年的经验,可以帮助公司创新和现代化其数据策略,以达到新的高度并支持战略决策。她有在大型企业和技术提供商工作的经验,曾在多个行业担任商业和技术职务,包括医疗保健、生命科学、金融服务、通信、数字娱乐、能源和制造业。
Moira Lennox
是 亚马逊云科技 的高级数据策略技术专家,拥有 27 年的经验,可以帮助公司创新和现代化其数据策略,以达到新的高度并支持战略决策。她有在大型企业和技术提供商工作的经验,曾在多个行业担任商业和技术职务,包括医疗保健、生命科学、金融服务、通信、数字娱乐、能源和制造业。
 Joel Farvault
是 亚马逊云科技 的首席分析专家,在企业架构、数据策略和分析方面拥有 25 年的工作经验,主要集中在金融服务行业。乔尔曾领导过欺诈分析、索赔自动化和数据治理方面的数据转型项目。
Joel Farvault
是 亚马逊云科技 的首席分析专家,在企业架构、数据策略和分析方面拥有 25 年的工作经验,主要集中在金融服务行业。乔尔曾领导过欺诈分析、索赔自动化和数据治理方面的数据转型项目。
 Mike Havey
是 亚马逊云科技 的解决方案架构师,在构建企业应用程序方面拥有超过 25 年的经验。迈克是两本书和许多文章的作者。他的
Mike Havey
是 亚马逊云科技 的解决方案架构师,在构建企业应用程序方面拥有超过 25 年的经验。迈克是两本书和许多文章的作者。他的
*前述特定亚马逊云科技生成式人工智能相关的服务仅在亚马逊云科技海外区域可用,亚马逊云科技中国仅为帮助您发展海外业务和/或了解行业前沿技术选择推荐该服务。